There is plenty of play-by-play on the post-NFP sell-off in the MBS Recap. If you haven't seen those updates already, that's a good place to start, and in terms of where MBS are and what they're doing, there's not much more to say. So we'll focus instead on the longer term implications, look at charts, and consider the week ahead.
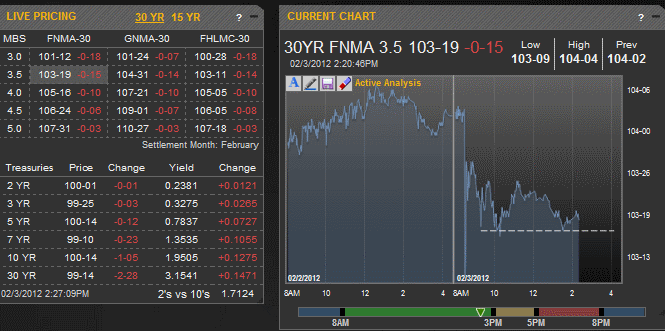
First off, here's some pictorial accompaniment for today's movement. MBS turn out to have been relatively drama-free since the initial sell-off, returning to bounce fairly convincingly for a second time at 103-18.

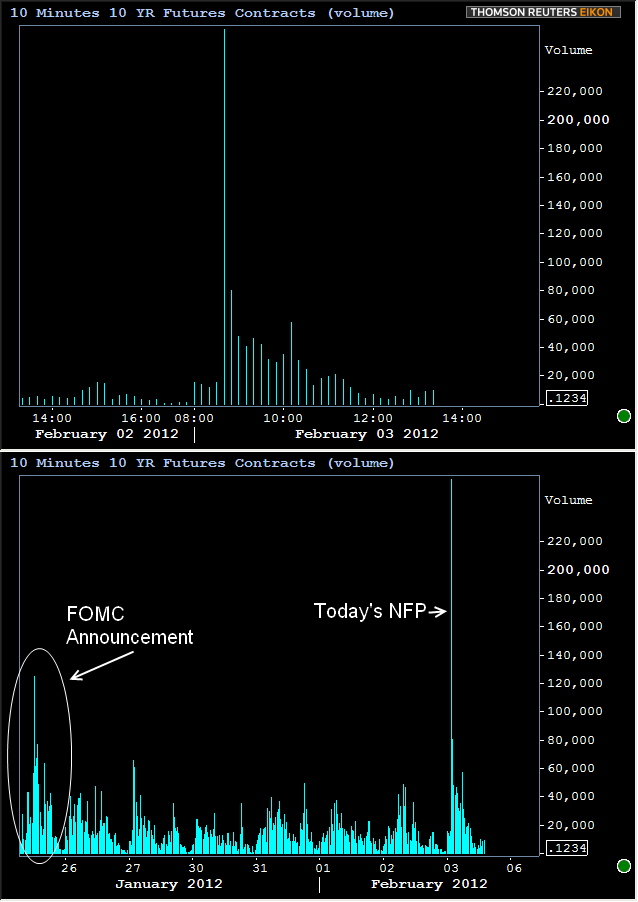
Even if MBS were now to break below that pivot, volume has basically dried up for the week, leaving the big bounces seen in the earlier heavy volume as the more significant from a technical perspective. To quantify the relative change in volume on the day and since the FOMC statement (last major volume spike), here's a chart of 10yr Futures Contracts volumes, both on the day, and you guessed it, since the FOMC statement:

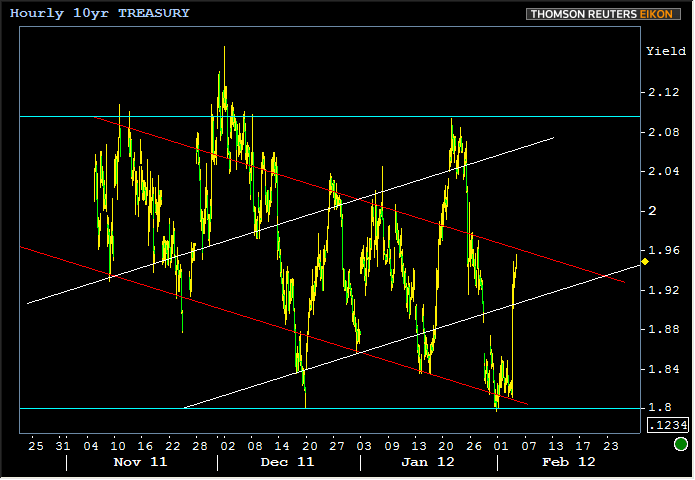
The biggest pop of activity from 8:30 to 8:40 took 10yr yields precisely to the lower white trendline in the chart below, as if to suggest that 10's should try their luck in this uptrend (the white parallel lines are an upwardly sloped trend channel). This is the first time I've charted this uptrend, but certainly, it's seen quite a few bounces, not only on the trendlines pictured below, but also on other lines of the same slope (not pictured below because frankly, the chart is crowded enough as it is, but feel free to use your mind's eye to see the other potential locations for the similarly sloped white lines).

Despite the losses, 10's clearly rejected the notion of testing a breakout of the red line. There's also a horizontal support/resistance pivot point at 1.95, meaning that all three trends are contenders heading into next week's auction cycle. Bond markets were clearly bullish headline into today's report, and clearly had been doing more to confirm the bullish trend (red lines). So rather than the usual "sideways uncertainty" being resolved by a big piece of data, we're instead left with a strong rally resolving into sideways uncertainty. If the upper red line breaks and 1.95 isn't offering any support, 2.04 and perhaps even 2.09+ might not be that far behind, although we'd generally expect dealers to reload longs up into that territory. Auctions, however, will be more informative than our general expectations in that regard. 3's, 10's, and 30's next week, and very limited economic data to distract from that.


