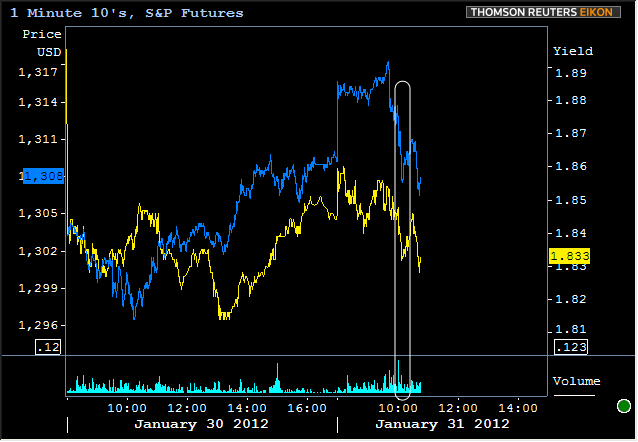
With the 10:00 AM print of this month's Consumer Confidence report, the morning's economic data is done. Stocks and bonds hadn't been too well connected until then, but the general movement since then has been in favor of lower yields and lower stock prices. This hasn't been entirely a factor of data, as the recently completed scheduled Fed Treasury buying contributed to the rally. S&P futures are down to 1305 at the moment after being as high as 1317 earlier this morning. 10yr yields are trading just below 1.83, and thus have recaptured most of yesterday's gains. 
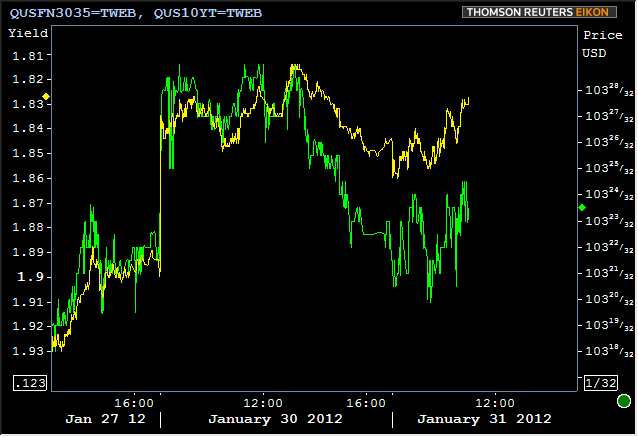
MBS are a different story. Whereas 10yr TSYs have merely experienced a measured little move beyond yesterday afternoon's weakest levels, MBS fell all the way to Friday afternoon's prices. Although MBS prices are certainly making gains with the rest of the bond market, prices are not yet back into yesterday morning's very tight range whereas Treasury yields are. This can be seen in the following chart. We've inverted 10yr yields and overlaid them with MBS prices (inverting 10yr y-axis means that the line will generally move in the same direction as MBS since MBS are displayed in Price and TSYs in Yield):
There are all sorts of explanations for the differences in performance between MBS and Treasuries, not to mention the most popular and always the most likely candidate when bond markets are rallying: Treasuries simply tend to outperform into rallies and underperform into sell-offs. There are other factors at play in the current scenario and all deserve a look.
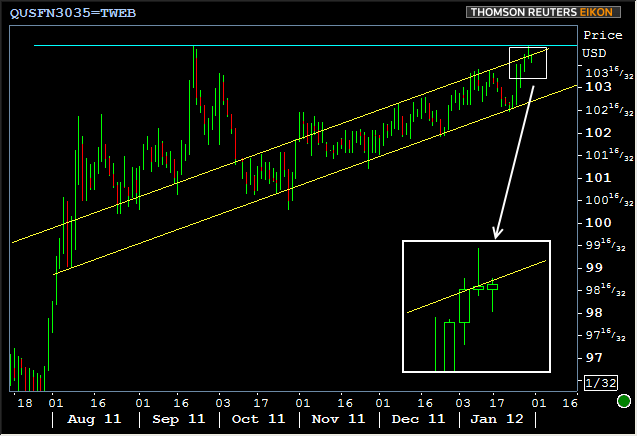
From a simple price perspective, MBS hit their all time highs yesterday and have been nudging the upper limits of a trend channel. Both of these technical factors could add to the sense of resistance at current levels. It's interesting to note that MBS prices fell far enough yesterday afternoon to get back inside the ongoing trend channel, thus getting daily resistance there while using the horizontal line at all-time highs as intraday resistance. Both lines are included in the chart below:
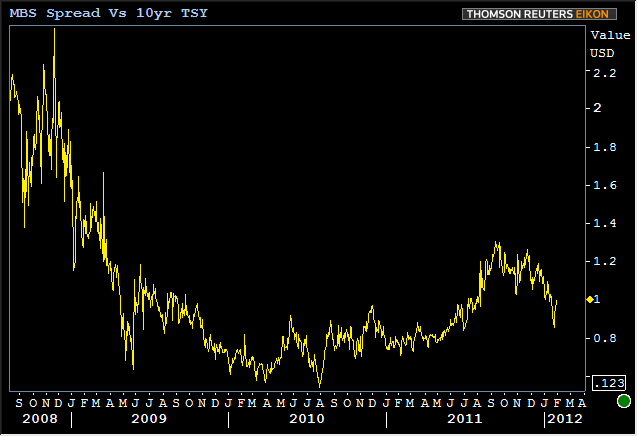
Then there's the matter of recent MBS performance vs Treasuries. Beginning with the inclusion of MBS in the September 21st FOMC Announcement (first mention of "twist"), spreads between MBS current coupons and Treasuries have been getting narrower (MBS yields closer to Treasury yields). These fires were fueled right through to the new year by speculation of MBS-related QE3's as well as the old cliche "more buyers than sellers." Seriously though... In this environment with such low Treasury yields, who wouldn't want an almost equally risk-free return? Demand for MBS has simply been quite strong, and production wasn't able to meet that demand. So prices rose faster than benchmarks. Here's a look at the long term spread between Fannie Current Coupons and 10yr Treasuries:
MBS Improve After Morning Data, But Underperforming Vs. Treasuries
Tue, Jan 31 2012, 11:29 AM
Download our mobile app to get alerts for MBS Commentary and streaming MBS and Treasury prices.


