The "flatness" of MBS prices is simply uncanny considering that Fannie 3.5's are currently right at their highest levels since late September, and considering the volatility earlier in the week. While it's true that the volatility was definitely expected ahead of the FOMC announcement, the extent to which it has subsided has been nothing short of astonishing. Now... I don't do a perfect job of keeping day-to-day and hour-to-hour tabs on implied volatility, but I do try to glance at 3-month floating vs 10yr fixed swaption straddles (which is one of more popular proxies for volatility in MBS markets). These are measured in basis points (BP), and essentially, the currently quoted BP value is "at the money," meaning the swaption contract makes money for the buyer if the spread between 3-month floating and 10yr fixed (3m/10y) interest rates go higher/wider than the quote. Therefor, the BP value will be higher when market participants are planning on more volatility.
Lately, the 3m/10y BP vols, as they're called, have been consistently over 100bps and often over 110bps. They're currently at 87.8. You don't need to understand anything about BP vols besides "lower = better for MBS" to see that 87.8 is damn good versus 100+. All this talk on the behind-the-scenes market metrics of implied volatility has been in order to quantify that which underlies the "astonishing and uncanny" flatness mentioned earlier. It really is quite something. But don't take my word for it! Charts!
(source: MBS Live!)
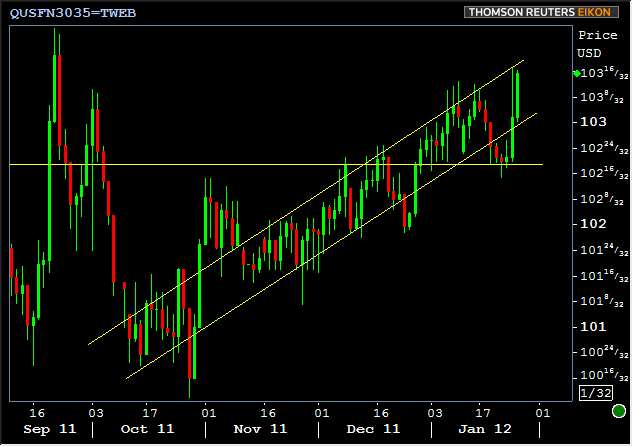
To get a sense of those "multi-month highs" in MBS, we'll have to zoom out a bit. This also provides a glimpse of just how perfectly MBS have returned to operate in an extended trend channel. Keep in mind that such trend-channels do not PREDICT where prices will go in the future, but the more that prices adhere to this trend, the more meaningful it will be when they break it. In other words, the lower line is once again a great trigger point to increase vigilance regarding any floating deals in your pipeline.

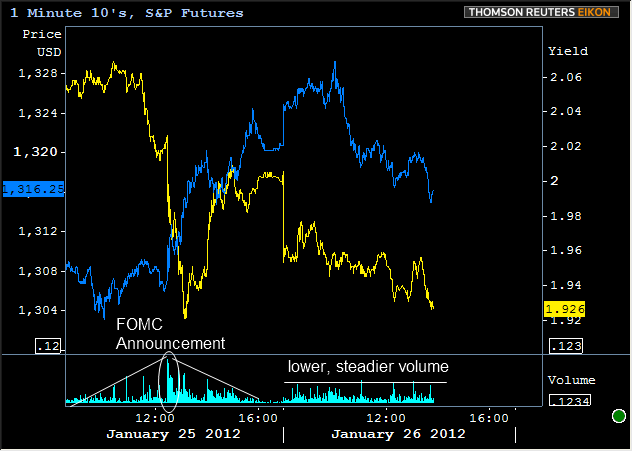
The decreasing volatility is seen in Treasuries as well, effectively basking in the warmth of FOMC sunshine today... Note that volume is relatively even-keeled compared to yesterday's glut surrounding the announcement itself (largest hour in several months), although there have been a few chunky moments today. Similar to MBS, Treasuries are approaching recent highs (highs in terms of PRICE, so low yields on the following chart) in a surprisingly narrow trading range considering recent levels and volatility:


