As has been the case so many times of late, MBS are holding steady while benchmarks are trending. Fannie 3.5's are basically trading at opening levels while 10yr yields continue a 2-day downtrend. The discrepancies are very slight, but it was same yesterday: MBS honed in on opening levels from 2pm on while 10's improved slightly.
Yesterday looked as if it would favor the short end of the yield curve, and indeed it did, both heading into the open and briefly following the 3yr auction, but the longer end fought back to a pivot point around 171bps (between 10's and 2's) and is currently at 1.6968. But that flattening trend is now contending with some technical resistance in outright 10yr yields as well as a potential pre-auction concession. The resistance is seen in the triangle below:
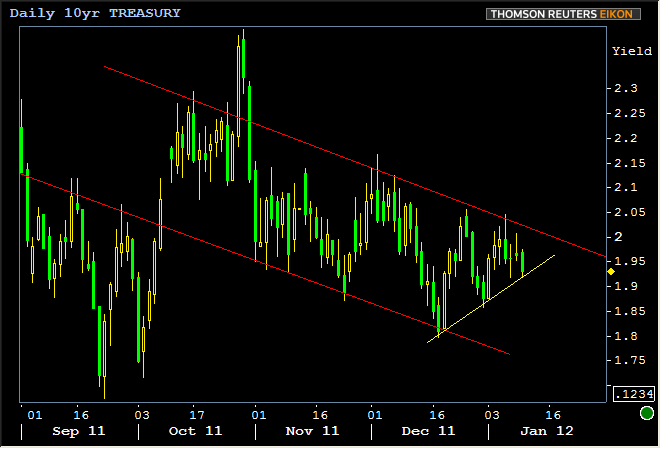
There's quite a bit of weakness that could be seen between current levels and the upper red support line if the auction goes poorly, but the relatively flat trading around 1.93/1.94 so far today seems to suggest the market knows where it wants to be. If that continues to be the case, MBS might continue to hold onto their own supportive trend. In fact, MBS are currently trying to hold on to an aggressive break outside the top of a long-term trend channel that we posted previously:
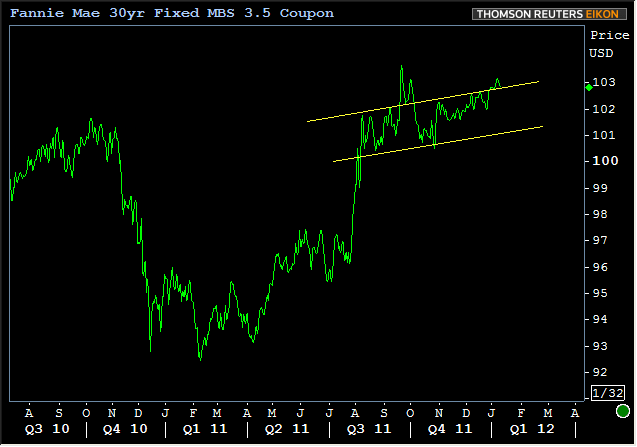
It's hard to see exactly how that upper line of the trend channel is acting supportively until one zooms in to a shorter time frame. To best illustrate this (as opposed to simply posting a short term chart with a random line on it), I snapped a video clip for you, which preserves the location of trendlines even as the periodicity of the chart is changed. I started with the chart seen above and then zoomed in so that you can see where 3.5's have bounced today in relation to the exact same line pictured above:
This isn't a guarantee of further support, but it is promising that there seems to be some technical support along this trendline even after the effects of last night's coupon roll. As we've said many times in the past, the highest and best use of such trendlines is not to predict the future, but rather to serve as "tripwires" that let us know when trends might be changing. We watch this trendline primarily for that reason and will let you know how it holds up in the future.


