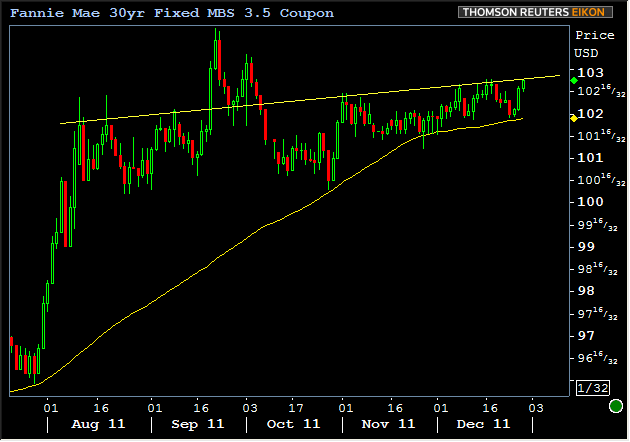
As expected/feared, this morning's economic data did little to rouse holiday-sedated markets. In fact, if it weren't for the somewhat interesting fact that MBS just hit their highs of the month in Fannie 3.5's, things look completely dead. But Fannie 3.5's creeping up into the 102-20's is good enough for Miracle Max to declare that markets are only "mostly dead." The following few charts constitute an attempt to bellow enough life into bond markets to at least hear them muster "to blave..."
Here's a quick look at the whole MBS Stack and Treasuries with charts of 10yr yields and Fannie 3.5's from MBS Live
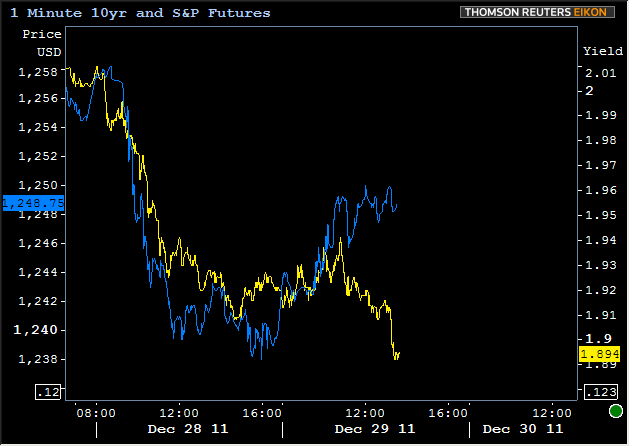
Just as Miracle Max's wife shouts "Liar!" in the above-referenced clip, Treasuries and Stocks are engaged in a bit of an argument as well.

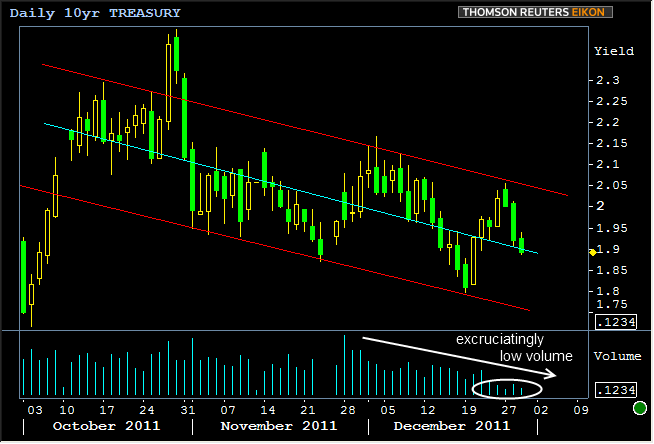
In the past, we might have suggested that one of the two markets above "is lying" to you (because it's generally uncommon to see such divergences that don't soon resolve to the benefit of one and detriment of the other). But in this case, it's ok... not only because of year end balance sheet considerations, but more importantly due to the insanely low volume. Even when volume remained high earlier in the quarter, 10yr yields had been adhering to the trend channel below, breaking higher for 2 sessions during the first (and "overly-hyped") EU Summit. So the fact that they've been cascading down this channel in quite an orderly fashion and now rest roughly on the mid-point as the year draws to a close is no cause for alarm. Furthermore, in this volume, a 10yr yield at 2.03 or 1.75 is just the same to us.

As far as MBS are concerned, they're perennial fans of regular and predictable behavior from 10yr Benchmarks and have risen to their highest levels since late Sep/early Oct. Here too, the improvements have been orderly, except for MBS, their volatility inspiring event centered on their inclusion in the late Sept FOMC announcement. But that soon moderated and gave way to the same trend of improvement against which Fannie 3.5's are currently bumping their heads. True, there are also trendlines that could be drawn underneath the range of prices by way of support, but I thought it coincidentally useful to note that the 80 day moving average picks up recent lows quite well, in addition to the scarier lows in late August and even pre-rally lows in late June. I generally hesitate to run techs on MBS (preferring the more technically reliable benchmarks and extrapolating the MBS implications based on recent behavior in spreads), but in this case, we may keep an eye on this moving average into the new year as a line in the sand, assuming that Treasury yields/futures are also throwing up similarly red technical flags.

Bottom line though... The day was over before it began. The dice were rolled and today's low-volume directionality turned out to favor bond markets. Some lenders will respond to that with improved rate sheets. We'll let you know if anything changes drastically, but otherwise will see you tomorrow for a holiday-shortened Friday that promises to be just as "mostly-dead" as today.


