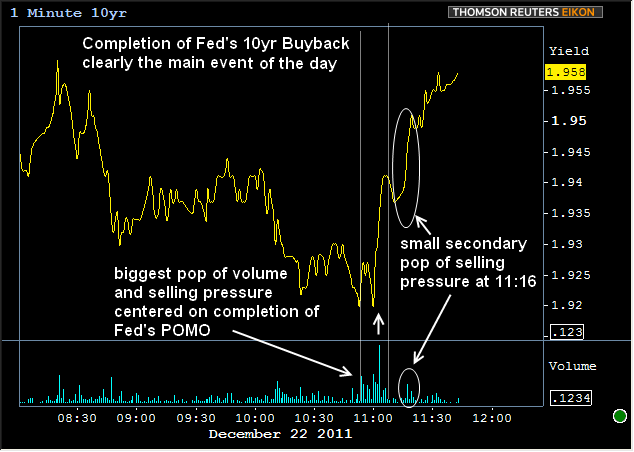
Despite the glut of economic data this morning, there was little, if any reaction to several reports at 830 or the remaining group at 9:55-10AM. The much bigger market mover was the Fed's scheduled buyback (also referred to as POMO, short for "permanent open market operation") of Treasury notes in the 10 year sector. This will be evident in the chart below, which will also do much to explain how and why things moved the way they did. The most important thing to keep in mind is that volume is extremely low and the week is effectively over (which also makes the entirety of 2011 effectively over).

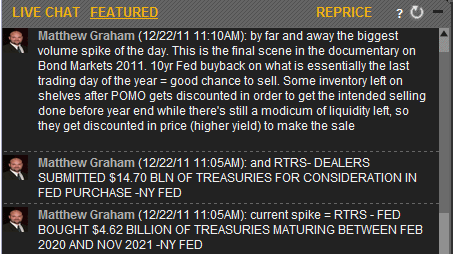
I offered a little more explanation earlier in the Live Chat on the MBS Live Dashboard:

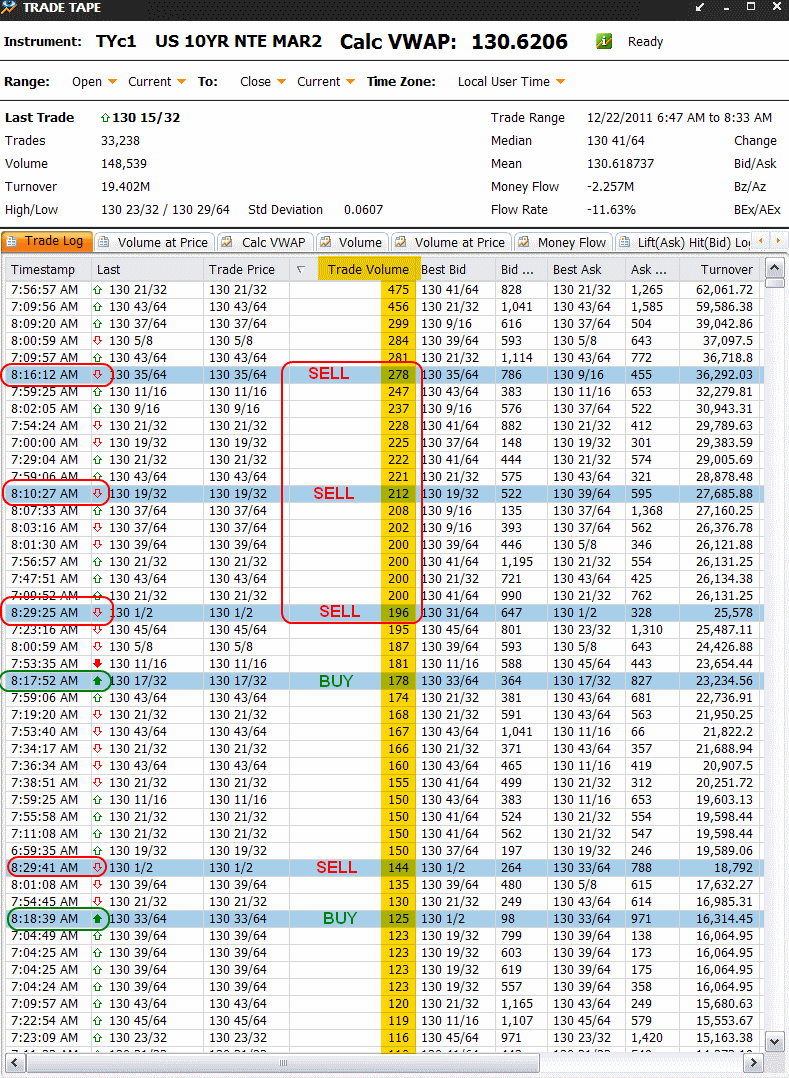
After the POMO, sellers continued to be in control. Here's a detailed look at 10yr futures tradeflows in my Viewer, showing that a majority of the day's biggest tickets after 11:10AM (shows as 8:10AM in the table below as I'm on Pacific time) have been on the sell side (little red arrows):

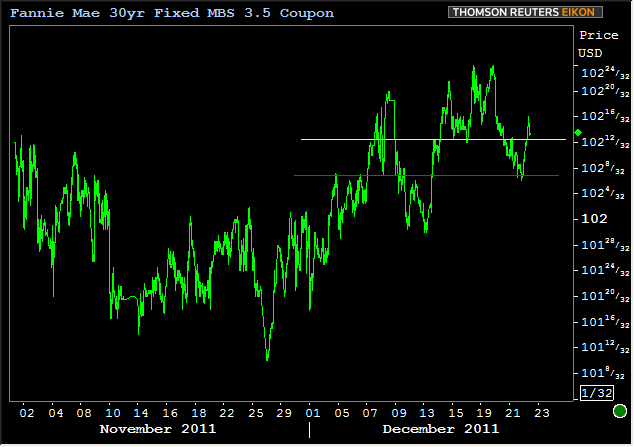
Despite the weakness (and choppiness in Treasuries, MBS have done a good job holding their ground. The screen clip from the MBS Live Dashboard below shows the deterioration in 10's versus a generally supportive pivot point in Fannie 3.5 MBS:
Even if MBS fall from here, the 102-06 level seen in the longer term chart below is the more important, longer term support, and generally supports a 3.875% Best-Execution Rate

With the POMO over, and liquidity drying up severely, further weakness is inherently possible. To reiterate that which has already been said, we wouldn't read much into the swings in prices or yields that could occur between here and the end of the year unless accompanied by some serious volume. Additionally, 10yr yields really aren't breaking any significant technical levels with today or yesterday's weakness. On the contrary, they've sort of been bouncing around near the center of their recent trend channel:


