After the last of this morning's economic data hit, we'd basically seen all there is to see this week. With tomorrow being a Quadruple Witching day, economic data is limited to a sole report (consumer prices) and the trading that does occur isn't widely expected to be high volume or of high importance. Indeed, most of the cards in various decks have been put on the table since Tuesday's 10yr note auction. Most of the remaining cards were drawn out after yesterday's 30yr auction and this morning's subsequent paradoxical reaction to better-than-expected economic data. In short, Europe remains in focus and markets remain unconvinced that catastrophe will be avoided. So even if domestic economic data is positive, to trade it as such would be like trying to swim against the obvious waves being made by the European situation as opposed to doing that which makes more financial sense: simply riding it.
That's not to say that bond markets will remain bullish forever and ever until the EU is "solved," merely that the verdict is in for this week (and perhaps this year?) and even if yields move higher between now and tomorrow afternoon, it won't mean much to the bigger picture unless accompanied by some serious volume (and it would be more convincing if it carried over into Monday too). All that said, our primary concern is the MBS market and this discussion is a bit too broad when it comes to how lenders may react to changing MBS prices. In other words, even if it's "no big deal" in the broader fixed-income realm to see some corrective losses in MBS in low volume, it could be a big enough deal to affect loan pricing, or spook a few lenders into mid-day reprices.
Our biggest concern at the moment is most a technical one: what are 10yr yields supposed to do after hitting the high 1.89's? Keep going lower? It seems, based on past precedent, that to expect such a credulity-straining turn of events would rely on some juicy piece of Euro-drama, or other snowball-inducing headline shocker. Hey... far be it from us to say that WON'T happen, but we would be a bit shy about allowing such things to be part of our pipeline planning. So we have 10's effectively as low as they go sans uber-drama, MBS as high as they go sans Fed-reinvestment-induced sugar high (late September), and lender rate sheets as aggressive as they've been ever. Of course these extremes won't look like extremes if 10yr yields some day trade at 1.5+, Fannie 3.5s at 104+ and the average 30yr rate is 3.25%, but if you're playing the range until the range plays you, we're pretty much there.
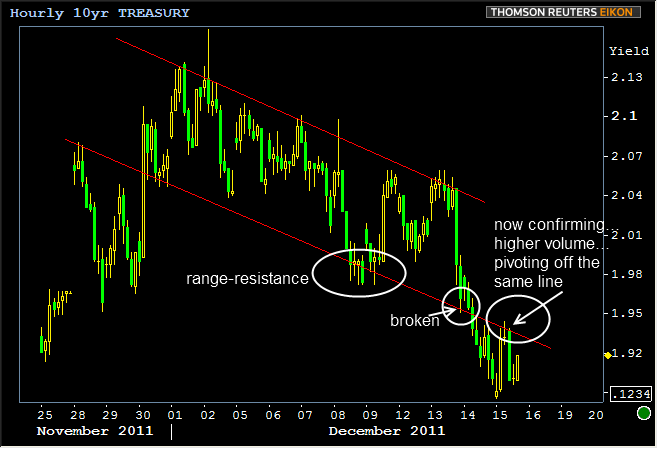
If, on the other hand, you're in the market for the extremes to keep being pushed to new levels, a few moderately bullish things happening on intermediate term charts for your viewing pleasure. First, take a look at the breakdown of the recent trend channel in 10's. The already bullish channel saw a breakout test yesterday and after yields popped up briefly this morning, a confirmation bounce off the "once floor, future ceiling" trendline.

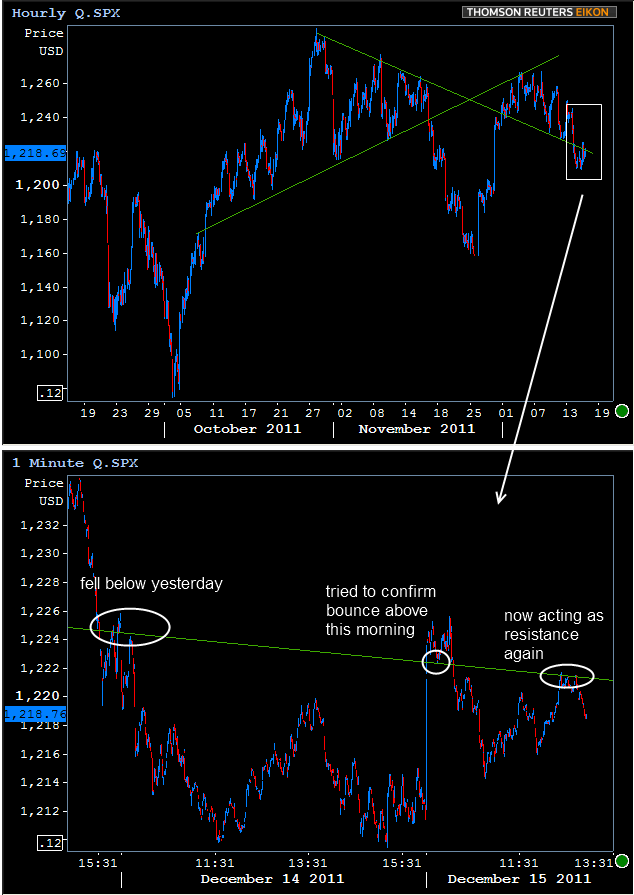
Similar pivot-based bouncing going on in Stocks. We're always hesitant to assume any degree of logic or technical significance from the equities side, but there's a possibility that S&P's are in the process of moving back within their previous downtrend. To show the "previous downtrend" part, the chart below has both the longer-term view of the triangle as well as a shorter term view that shows some of the specific behavior around the line. Decide for yourself.


