Today has been fairly insane if you're simply looking at the chart of MBS prices. In fact, today has been pretty interesting even for market participants who are already up to speed on the causes of the MBS/Treasury rally. It seems like it's quite an impressive feat for MBS to be able to make the sorts of gains they've made in recent sessions only to add on to those gains again today, taking them up and over recent technical ceilings. But there are two "usual suspects" when it comes to market phenomena that can drive such erratic behavior.
The first is the MBS Settlement process. If you need a refresher on that, AQ did a fairly thorough write up on this back in the day (read it). As far as it's role in driving erratic rallies, we've seen pre-settlement trading on numerous occasions artificially lift the following month's MBS prices up to the outgoing month's price levels over a 1 to 2 day period leading up to the actually "drop" at the end of notification day. But in and of itself, that probably wouldn't quite cut it in terms of accounting for today's rally.
The second factor gets us most of the way to a workable explanation of today's erratic rally. In a word: snowballing. This rally didn't just happen in MBS, but in benchmark Treasuries as well. Think of it almost like a miniature "run" on the bank of available fixed income supply. Everyone wanted to buy Treasuries and to an even greater degree, MBS. But the shelves were quickly emptied. Volume was LOW in Treasuries and plentiful buyers quickly drove up prices against that backdrop. The higher the prices went, the more technicals were triggered, the more the demand rose, the higher the prices went, and so on. Any profit taking was fairly quickly gobbled up by the relentless onslaught of bid-side demand.
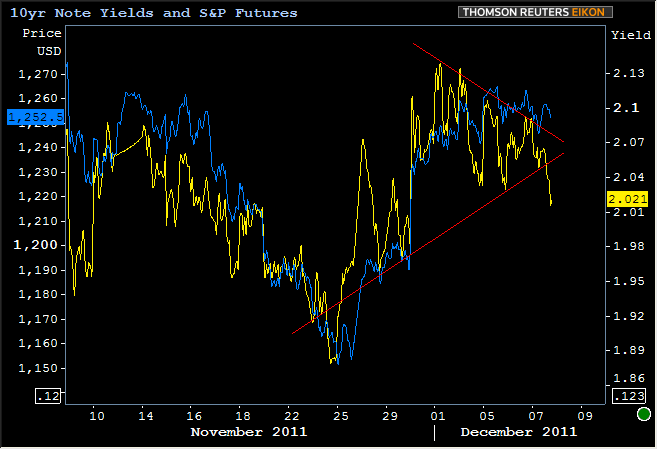
Here's a look at how much differently today's trading transpired in Treasuries versus Stocks. This is an updated version of the 10yr yield triangle chart from this morning. You can see the triangle is broken on the downside now, but we also overlaid S&P futures to show how directional the Treasury move was by comparison (divergences like these are usually good clues that something outside the ordinary is happening):
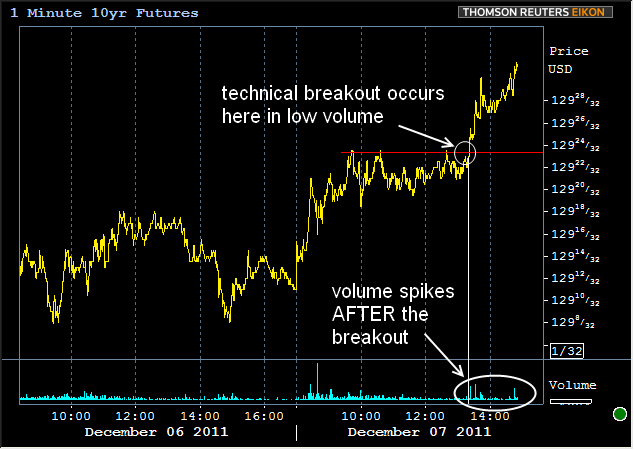
Although there were a few bond-market-beneficial headlines that helped fan the flames today, the fire was primarily fueled by technicals, initially the supply/demand technicals already mentioned, and then by technical price triggers. One of the best examples we see is in 10yr futures which had been bumping up against a ceiling of resistance, broke out on LOW LOW volume, and immediately got lifted even higher in increasing volume. In other words, it looks like the break was a technical trigger for more buying, black box or otherwise.
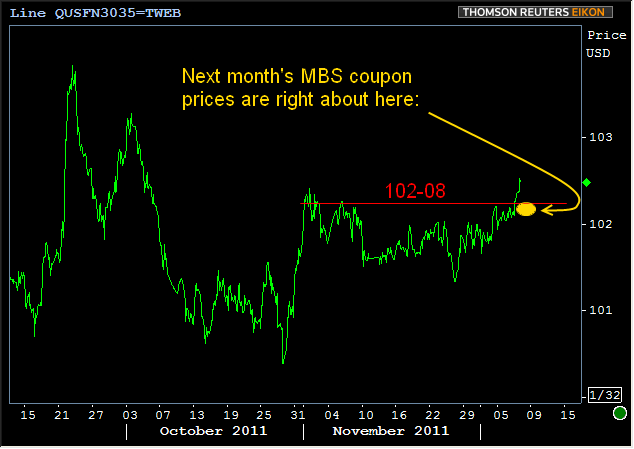
MBS are coming off their highs as this is being written, but even if Fannie 3.5's were to remain around 101-16, by the time prices drop for tomorrow afternoon's roll, prices would be in the yellow circle below, making the chart look like a mere and measured extension of the gently sloped uptrend, and still no higher than November's post-roll highs ("post-roll" mentioned specifically because MBS prices were never higher than 102-08 except for the few days leading up to the roll). Not saying that prices will go no higher... Just offering some thoughts as to why we wouldn't see more reprices than we did on such a seemingly high rally as well as saying, while exciting, it's not quite as exciting as it looked.