By now you've heard that U/E came in at 8.6% today versus a 9.0% expectation. So naturally, with labor metrics that bullish, bond markets had to rally. Wait... What?!
Normally, we'd expect to see surprisingly strong jobs data catalyze WEAKNESS in bond markets (falling MBS prices, rising TSY yields) as opposed to the STRENGTH seen today. There are a few reasons for this. It's Friday night, so we'll go with bullet points to keep the reading load to a minimum:
Reasons We Ended Up Rallying Despite 8.6% U/E
(not in order of importance, and certainly not all equally important)
- Headline NFP merely met expectation. Given the impressive stock rally/bond sell-off of the last 2 weeks, perhaps we needed a higher headline to sustain those levels
- The U/E portion of the report is based on the Household Survey which polls 60k PEOPLE as opposed to the establishment survey that talks to 400k EMPLOYERS (in other words, the latter is more reliable)
- Labor participation rate fell to 64.0 from 64.2, that's 315k fewer people accounted for in this month's survey vs last.
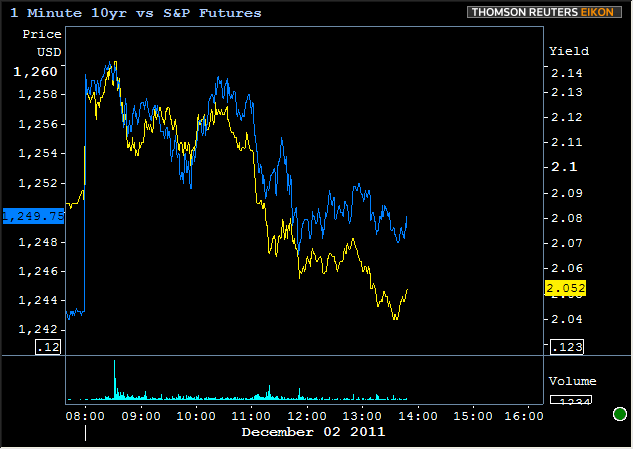
- Treasury yields may have rallied, but didn't break a recent uptrend (chart below)
- Markets ultimately care more about European contagion than domestic economic growth and the former was bond-friendly today
Bottom line, 8.6% ends up being a very small piece of the puzzle by the time US Fixed Income demand is accounted for. There are more reasons to buy Treasuries and MBS at this morning's levels than the 8.6% unemployment suggested reason to sell. Here's a look at levels and charts this afternoon in MBS and Treasuries courtesy of MBS Live.
Despite the rally, we still need to resolve some unfinished business next week as we determine whether or not 10yr yields will adhere to this uptrend (definitely acted as resistance to further gains today)

If current volume and volatility are an indication, it looks like today's excitement has been over for a while (volume in teal along the bottom is 10yr futures):

Since we took a longer term look at Treasuries, here's a longer term look at stocks as well. I was interested in how recent price action in S&P's moved to the defeated trendline from the recent epic triangle, and looks to have met some resistance there. AQ and I talk techs fairly often and he actually mentioned the same thing to me before I mentioned it to him. He also added that the following retracement levels have been very well-behaved since that triangle breakout, all of the above suggesting a high level of uncertainty heading into December and year-end as stocks choose the equivocal safety of technical range-trading.

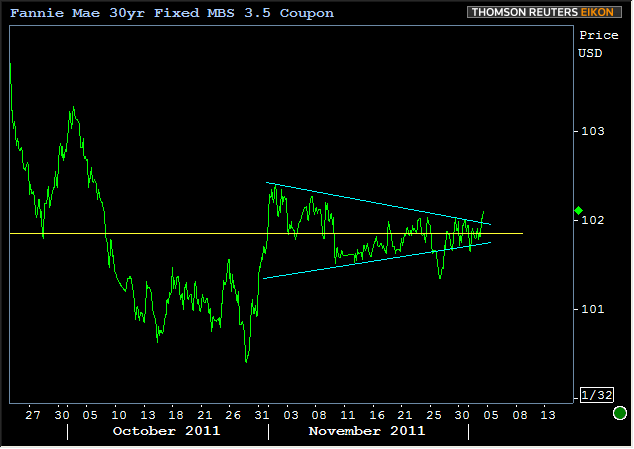
So now that stock and Treasury charts are out of the way (and now that we see both of them would historically seem to suggest pressure on MBS due to generally higher yields and stock prices since late November), it's refreshing to see MBS continuing to do what they've been doing: Honing in on 101-26. In fact, it looks like Fannie 3.5's might even break out of this consolidation to the upside, but we'd expect that breakout to be fairly contained unless 10yr yields continue to favor the 2.07-1.95 range.

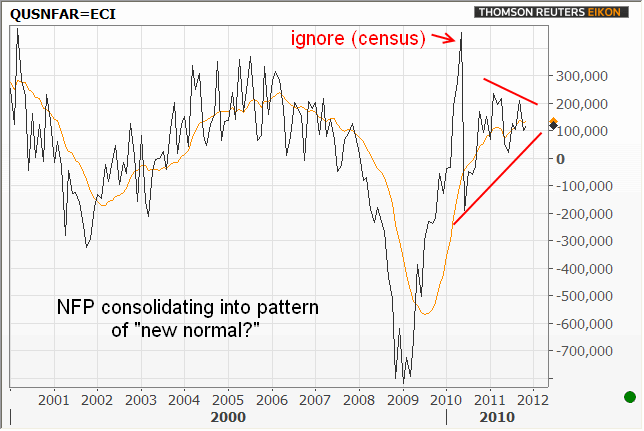
But the "Consolidating Range" award of the day had to go to the long term chart of Non-Farm Payrolls. The headline has been volatile over the past few years, but it does indeed look like NFP is honing in on a "new normal," as so many people have mentioned today. Not to jump on that bandwagon, but the consolidation is hard to ignore. The reason I also see it as a "new" normal is that it's a bit lower than historical periods of consolidation. The orange line is the 12 month moving average by the way... What do you see? How would you describe what's already happened and what you think will happen?


