This morning's update from MBS Live:
MBS Stronger Than They Look Factoring Out the Roll 8:28 AM
While it's plain to see that broader bond markets are weaker overnight, MBS specifically look weaker than they actually are. The settlement of November Fannie/Freddie 30's took place yesterday and the new "front-month" coupon is a December delivery. That means that yesterday's prices on the chart reflect November coupons while today's reflect December's, which closed at 101-22 last night, meaning that Fannie 3.5's are actually only 1-2 ticks weaker in this morning's trading--not bad!
The other glimmer of hope comes from the distinct double top in 10yr yields overnight at 2.05. Normally we wouldn't read much into technical developments from the nocturnal session, but volume was particularly good, approaching 300k 10yr contracts by 8am NY time vs 100-200 normally. Stock futures are making similar moves but closer to breaking higher past their best levels overnight.
The point about 2.05 in 10yr yields isn't exactly a suggestion that this will hold up as a supportive ceiling as much as it is to point out that it acts as a good line in the sand to let us know if we're at risk of losing more ground. To that end, this AM's economic data, in the form of Jobless Claims and Import/Export prices is coming up in just a few minutes and could serve as the impetus to either help 10's confirm their 2nd bounce lower off 2.05+ or break higher, forcing bond benchmarks to search for that next level of support.
----
Indeed, economic data combined with European headlines combined to help 10yr benchmarks get their supportive bounce of 2.05. Here's the recent live action on the MBS Dashboard:
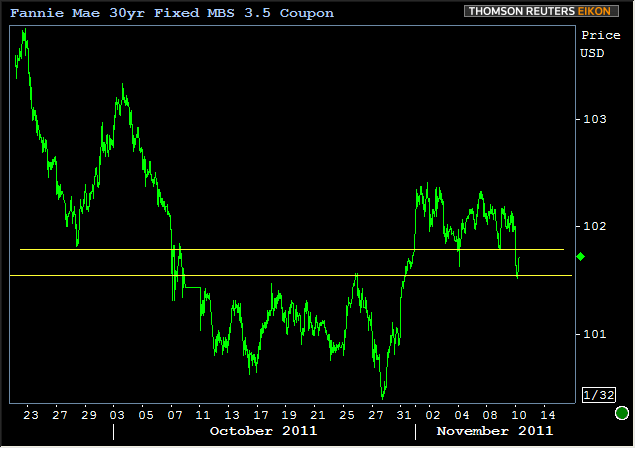
Prices of December Fannie Mae 30yr Fixed MBS are actually very close to unchanged at the moment. The following chart gives a visual on "the roll" in that it's showing November coupons on the left and December Coupons on the right.
Despite the ground-holding in benchmarks and MBS ability to claw back to breakeven levels day-over-day, lenders have been EXTREMELY TENTATIVE out of the gate in terms of pricing with an average worsening of .3 to .5 in cost. That could be due, in part, to factors seen in the chart below, showing that 3.5's are near a tipping point between November lows and October highs. If these lines are held, pricing should improve:

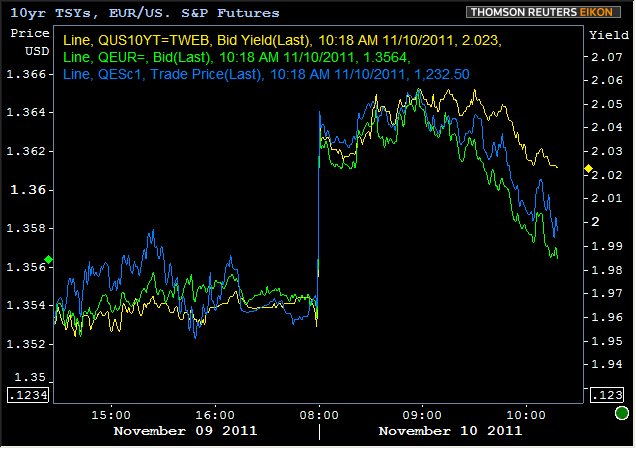
As far as the factors that could help that supportive bounce occur, we continue to watch the Euro and Stock lever. As the next chart shows, both of those markets would suggest a better performance by Treasuries this morning. But the latter will resist falling into line until at least after this week's auction cycle is successfully completed at 1pm today with the 30yr bond auction. The "drifting" seen on the part of the yellow line in the chart below is essentially a visual representation of "caution" and "preparation" heading into that auction.


