Actually, MBS are 2 ticks UP as opposed to down, but I refuse to rewrite this blog and re-do my charts simply because markets are too flighty and indecisive regarding all the headline drama right now... That's it... Game over man... Game over... Can't take it any more... Give me the foil hat and conspiracy theory pamphlet... The rest of my natural life will be devoted to waiting for any piece of news about the EFSF and basing all decision-making and analysis on that.
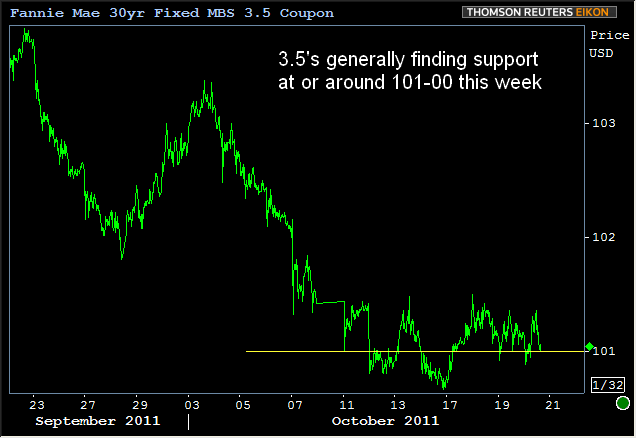
Seriously though, markets have moved since I put these charts together, but that's ok for two reasons, maybe 3... First, MBS are improving. Second, that improvement validates some of the technical suggestions I make in the charts below. Third, perhaps in some small way it reinforces the sense a human being writes this stuff, and is sadly constrained by typing speed and such. With that in mind, how about less typing and more charts? First off, with the choppiness of today's trading in mind, it's comforting to see an ongoing case for support at 101-00 in 3.5 Fannie MBS:

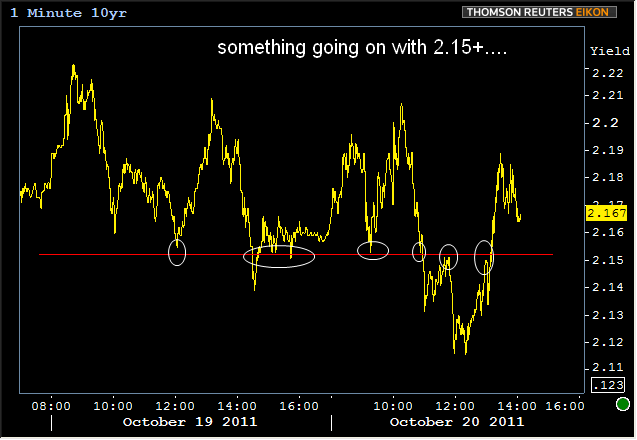
Since that chart, the movement that I lamented above constituted a nice-looking bounce higher, but who's to say that will still be the case by the time I'm done writing? Or perhaps that should be "who, other than the EFSG gods?" The bigger technical story, or at least the more deeply significant technical story, and the one that will help inform MBS ability to hold their line is in 10yr Notes. Looking at today's short term chart, we notice something going on at 2.15+

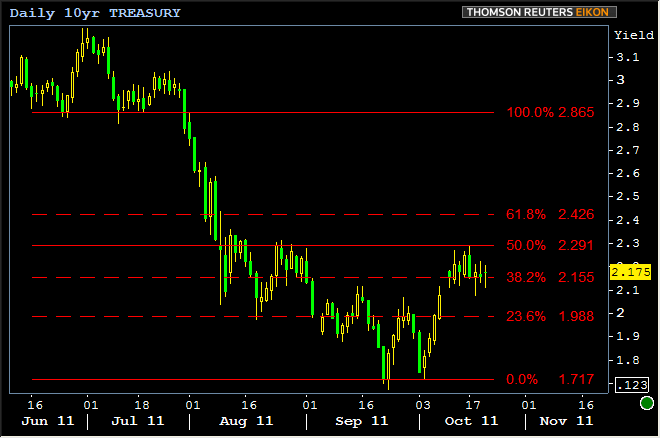
Since that chart, 10's moved back down exactly to that line and are now bouncing higher again... The technical movements are just crazy these days... But I digress... The chart above led me to explore an alternative way to set retracement levels for recent 10yr yield movement. I left the bottom line in the same place it's been in on recent charts, but took the 0% line up to the most prevalent "low" before the major rally down into the 2's began. Turns out 2.15+ fell on one of the lines... Who knew?!

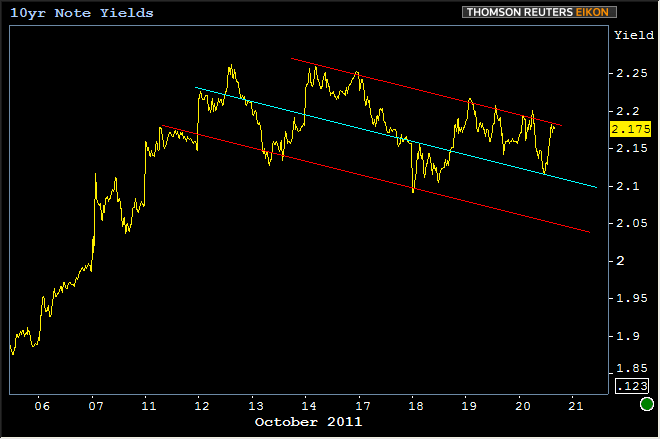
The 2.155 level above is important right now because yields haven't closed below that since 10/7 and because it continues to emerge as an intraday pivot point. 30 minutes left to the official 3pm close and 10's are currently at 2.157. Exciting stuff.... But perhaps not as exciting as the possibility that when I redid the fibonacci lines above, it left 2.29 sticking out as a recent level of technical support. If it continues to be supportive that means that we're trending positively, and the following chart is a potential shape that the positivity could be taking... Very hypothetical, but we can keep an eye on how well this channel holds up. If it stays strong, MBS would benefit.

Thoughts? Feedback? What charts are you interested in seeing these days?


