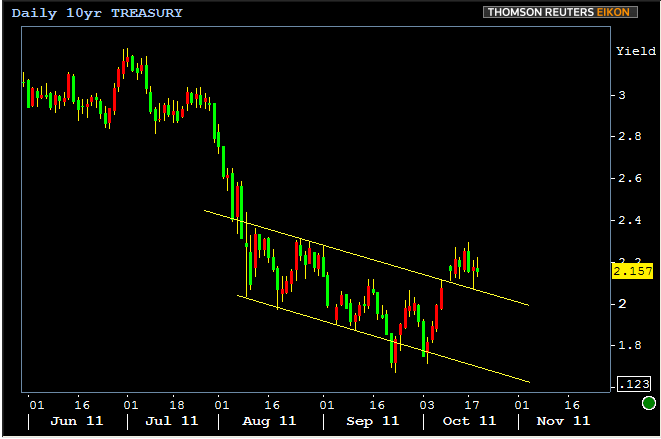
We had an extended conversation the other day about what technically constitutes a "breakout." In fact that's a pretty good article to revisit in general due to the ongoing pertinence of the levels it discusses. Back then, we were hoping for 2.125 to hold up as some sort of support and for yields to bounce lower. Instead, yields broke through and yields haven't closed lower than 2.125 since... But could the past two weeks end up simply being a move outside the broader trend, similar to Septembers break below the lower trendline (early October had a small break as well)? In the chart below, are we looking a few instances of "testing a potential breakout" on either side of a trend channel that will ultimately regain prominence?
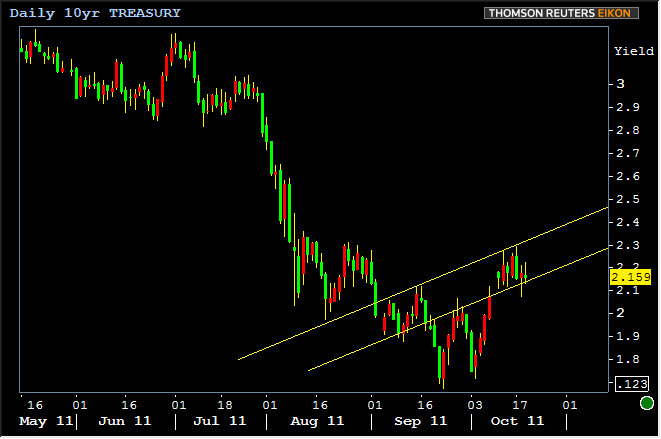
Long story short, no... At least that's not what charts are indicating at the moment. The breakout of that trend has been confirmed and here's why: Using the numbers and ovals on the following chart as a reference,
1. yields move lower, outside the channel, but the following day move back into the channel. Result = breakout fails to confirm
2. Same thing as in #1, but on a smaller scale.
3. After 2 failed breakout attempts, market stampedes quickly and EXACTLY to the other side of the channel.
4. Yields break out of the channel the following day and have traded outside the channel every single day since.

Indeed, that era may be over, but it doesn't mean we might not be in a sideways era. In fact, that's why we said on 10/7, in reference to the rally trend potnentially holding support: "That's what we're HOPING will happen on Tuesday, but if it doesn't, we'd turn next to an assessment of a SIDEWAYS trend, by way of transition from the recent diagonal trends." And so, that's why we've been harping on the following chart a few times since then...
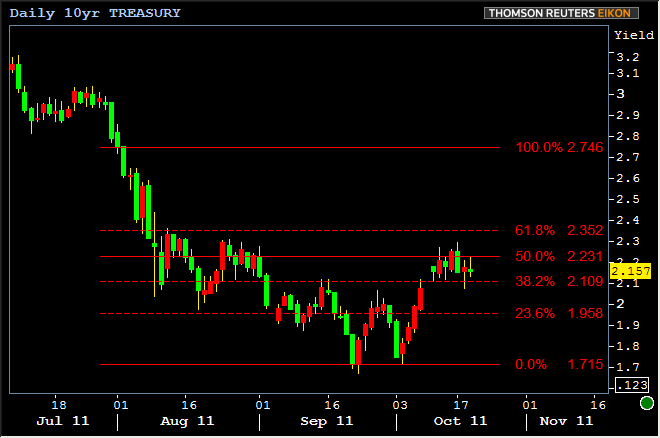
It's nice that markets haven't closed above 2.231 for two days in a row (failed confirmation of breakout). But do keep in mind that technical analysis is subjective, and bond bears shouldn't stick their head in the sand when it comes to considering that yields could be in an uptrend.
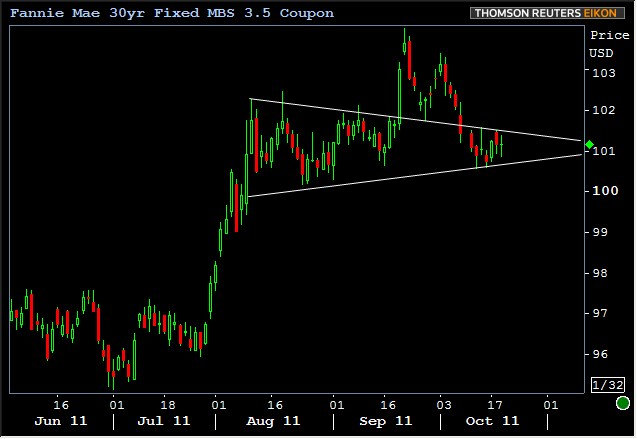
Treasuries, at the very least, need to break that lower yellow line in order to give some assurance that yields aren't in an uptrend. Personally, I'd tend to ascribe slightly more to the "sideways" viewpoint right now, especially with stocks unable to break the 1220's in S&P and of course, considering 101-ish support in MBS and 2.25%-ish ceilings in 10yr yields. But I'd ascribe EVEN MORE to the notion that anything's possible these days. One thing that certainly looks possible is that MBS could be trading a narrowing range into something around 101-00. Depending on whether or not Treasuries decide they're holding sideways or rising in yield could well decide which direction this triangle is broken: