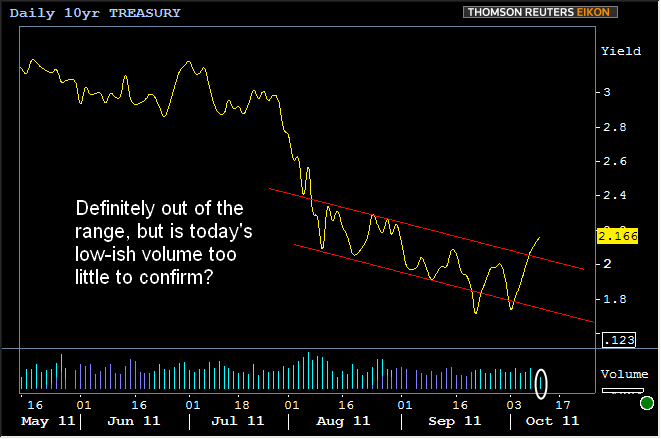
"The trend is your friend," or "play the range until the range plays you..." Two of the commonly heard phrases during periods like the last 2 months in bond markets. Last week's NFP in conjunction with optimism over the European debt crisis sent yields well out of their reliably-travelled trend channel and we awaited today's trading as confirmation or rejection of that breakout. With zero exceptions, 10yr yields traded inside a trend channel outside which, yields never closed for two days in a row. Until today. But considering the relatively low volume, and a few other phenomena in the charts that follow, do we certainly have enough to label this a breakout?
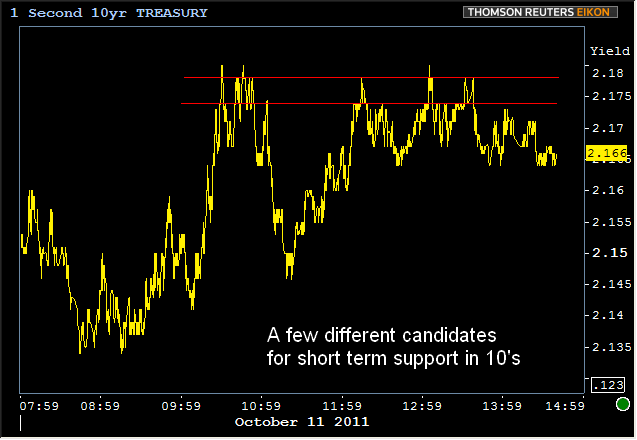
If 10yr yields were to return to the trend channel tomorrow, this breakout wouldn't look much different than the late September break to the downside. But at the risk of being overly optimistic, let's assume today's close outside the channel is indeed a breakout, even if the confirmation could have been more convincing, and that we'd now look to horizontal price levels (a sideways trend) before considering that yields are either reentering a bullish trend or fully reversing into a bearish trend. A few different horiztonal support levels emerged this afternoon in the mid 2.17's (although 2.17 was also a significant pivot point 2 months ago). If yields are at similar levels tomorrow, we can watch these either as warning signs of a deteriorating situation (if yields break above) or reinforcement of potentially supportive trends (if yields bounce lower off these same levels).
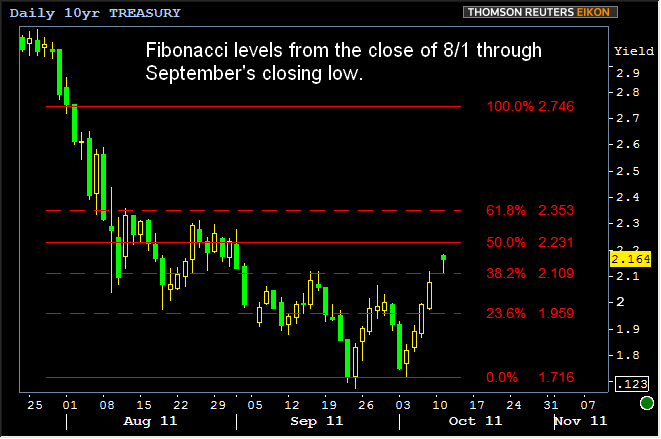
In the bigger picture though, we'd probably be more excited about a break below 2.11 and more concerned about a break above 2.23 on the high side. You can see eich of those levels on the chart below which sets fibbonaci retracements based on closing yields from 8/1 to now. This is just one way to apply these ratios to recent trading. There are other good technical candidates, and we'll adjust the chart overlays accordingly if others start getting more significant action.
There's even a case for support right at today's high yields. Not only did we get a glimpse of that earlier in this post, but stocks also looked hesitant today, seeing some firm overhead resistance that is still intact with about 15 minutes left to trade.
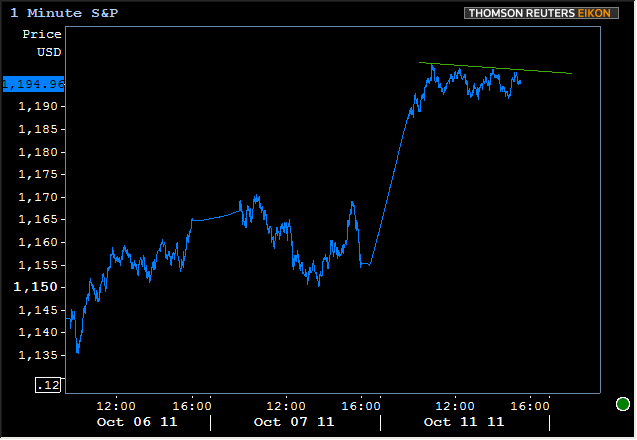
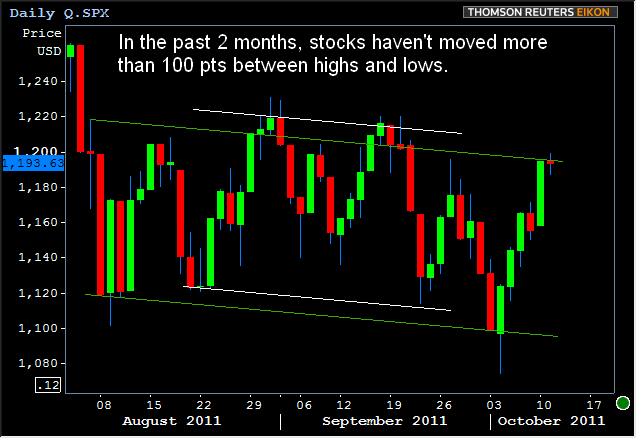
One reason stocks might be having a hard time breaking much higher is that they don't really move more than 100pts at a time from trough to peak, and the move so far in october has been almost perfectly 100 pts. Just like it was from late August to Sept 1st, and just like it was when stocks started to recover off 2010 lows (not pictured). Bottom line though is this: so far, nothing special has happened for stocks other than a correction within a range.
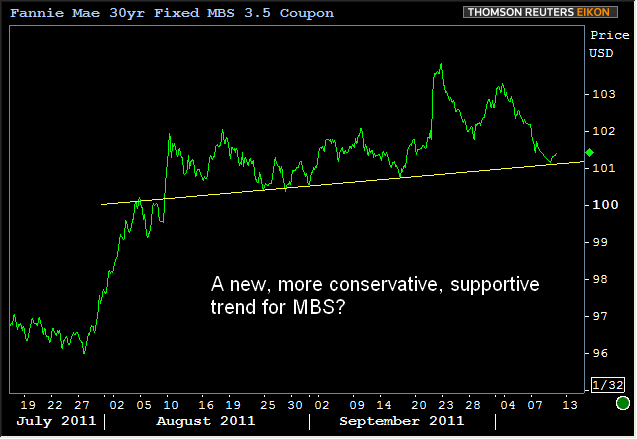
And through all that drama, MBS are just sort of minding their own business, enjoying an uptick in buying demand from money managers, hedge-funds, overseas, and of course, the Fed, all offset by relatively little in the way of supply. Maybe it'll be enough to help MBS maintain the supportive trend pictureed below, although after this week's MBS settlement, it'll be close.
