Existing Home Sales data just printed. Here is the Reuters Alert...
RTRS 10:00 - US MARCH EXISTING HOME SALES 5.10 MLN UNIT ANNUAL RATE (CONS 5.00 MLN) VS FEB 4.92 MLN (PRV 4.88 MLN)-NAR
RTRS 10:00 - US MARCH EXISTING HOME SALES +3.7 PCT (CONS +2.5 PCT) VS FEB -8.9 PCT (PREV -9.6 PCT)-NAR
RTRS 10:00 - US MARCH INVENTORY OF HOMES FOR SALE +1.5 PCT TO 3.549 MLN UNITS, 8.4 MONTHS' SUPPLY-NAR
RTRS 10:00 - US MARCH NATIONAL MEDIAN PRICE FOR EXISTING HOMES $159,600, -5.9 PCT FROM MARCH 2010-NAR
RTRS 10:00 - US NAR SAYS 40 PCT OF U.S. MARCH EXISTING HOME SALES WERE DISTRESSED SALES, HIGHEST SINCE APRIL 2009 (45 PCT), VERSUS 39 PCT IN FEB
Plain and Simple: Better than expected and improved from February. 40% of sales were distressed inventory though and home prices fell 5.9%.
Market Reaction...
Stocks are moving sideways just below their overnight highs in a low volume trading environment. S&Ps are currently +18.25 at 1326.25.

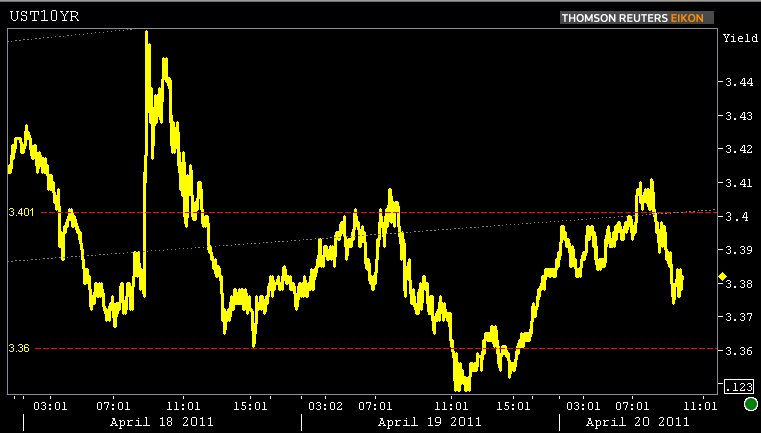
The 10-yr note is still weaker on the day but off its worst levels. 10s are -4/32 at 102 the figure yielding 3.382%. 3.40% support held....
Treasuries have disconnected from the stock lever. WHY?
Position Squaring! Investors are getting flat ahead of next week's high risk FOMC meeting. We discussed this behavior in the day ahead. "It looks like we're gonna find out just how nervous the TSY short-base is at these lower dollar prices. This is either an opportunity to cover at lower dollar prices or add new shorts. Position squaring seems like a better idea ahead of next week's FOMC meeting!Cash looks like the smart spot to be in"
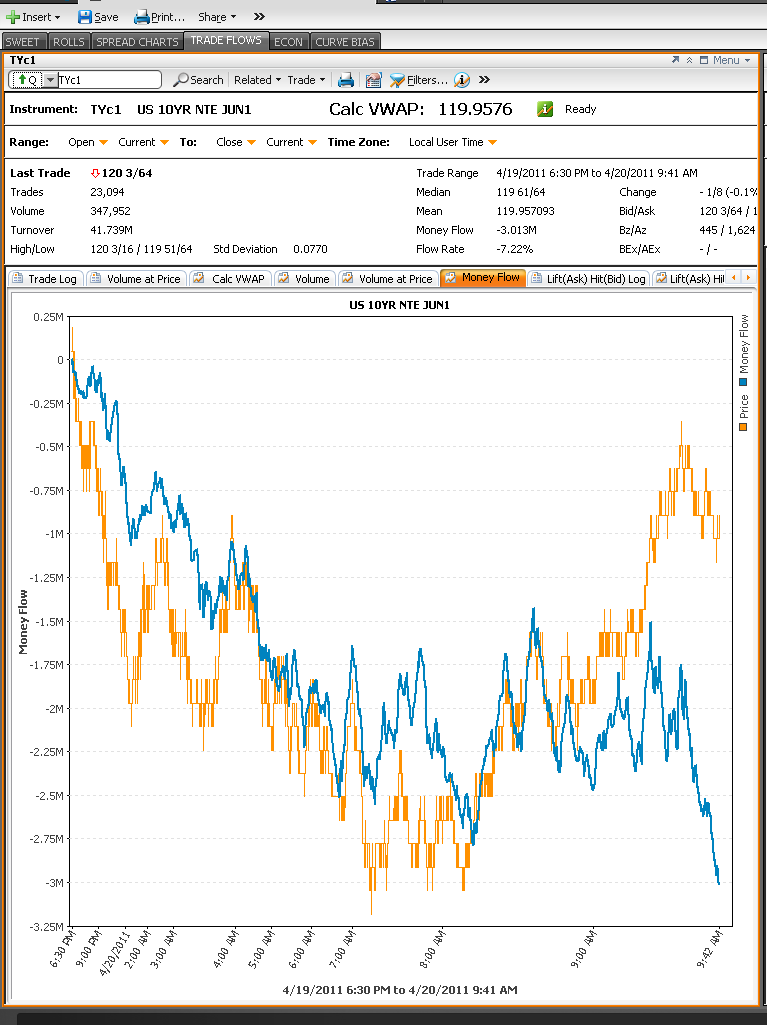
That is indeed the case. Trading volume is low. Liquidity is lacking and short positions are being covered. Check out my trade flows screen below. Notice prices going up and money flows going down? That means money is exiting the market. When prices are rising and volume is low and open interest is falling...PRICE ACTION = SHORT COVERING
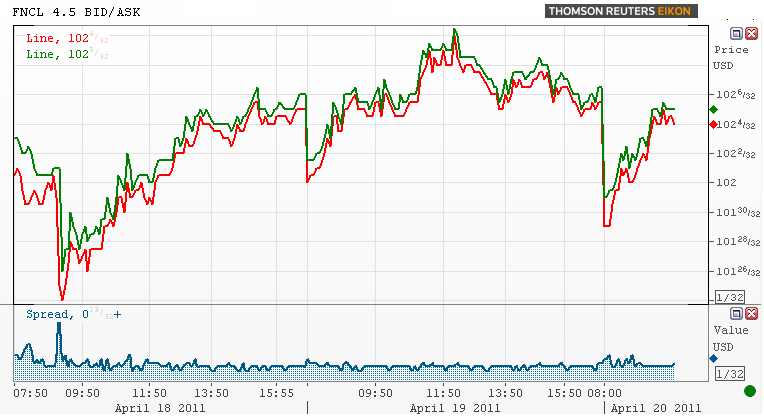
The big winner of the group: MORTGAGES!
Prices are still in the red and rate sheets are worse but current coupon MBS are outperforming benchmarks. Yields spreads are moving tighter. I've got the secondary market current coupon marked at 4.125%. +74.3/10yTSY, +68.6/10yIRS, +203.1/5yTSY.
WHY?
While lower lock volume implies less business for loan originators, there is an upside in the production slowdown: Loan Pricing isn't deteriorating at the same pace as benchmark Treasury yields. Why? One answer has to do with Supply and Demand in the secondary market. Fewer new lock requests means less new MBS supply in the secondary mortgage market. Less new loan supply in the TBA MBS market (loan pipeline hedging) means less sellers are present. This is a favorable trading environment for all mortgage-backed securities market participants, which explains why MBS have generally outperformed their directional guidance givers (Treasuries) lately. For loan pricing watchers specifically, it lessens the pain of a prolonged bearish trend in benchmark yields.
We aren't over-thinking this price action. Volume is missing. Liquidity is lacking. Investors are just trying to get their book prepared for next week's high profile FOMC meeting.


