The Bureau of Labor Statistics has released the Consumer Price Index for February 2011.
The CPI is the most widely relied upon measure of inflation. Prices for the goods and services used to calculate the CPI are collected in 87 urban areas throughout the country and from about 23,000 retail and service establishments. Data on rents are collected from about 50,000 landlords or tenants. As a means for adjusting income payments. Over 2 million workers are covered by collective bargaining agreements which tie wages to the CPI. The index affects the income of almost 80 million people as a result of statutory action: 47.8 million Social Security beneficiaries, about 4.1 million military and Federal Civil Service retirees and survivors, and about 22.4 million food stamp recipients. Changes in the CPI also affect the cost of lunches for the 26.7 million children who eat lunch at school. Some private firms and individuals use the CPI to keep rents, royalties, alimony payments and child support payments in line with changing prices. Since 1985, the CPI has been used to adjust the Federal income tax structure to prevent inflation-induced increases in taxes.
Reuters Quick Recap..
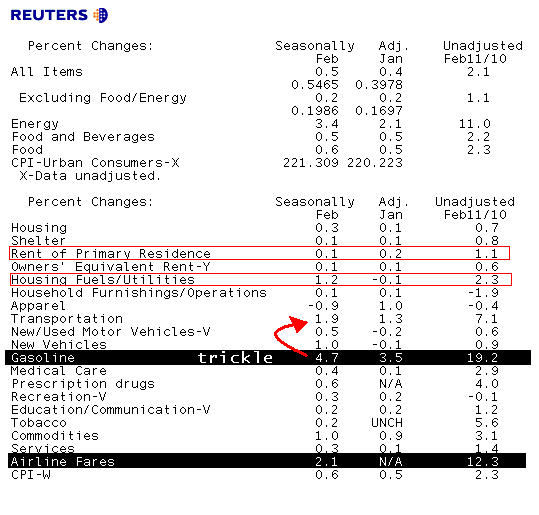
RTRS-U.S. FEB CPI +0.5 PCT (+0.5465; CONSENSUS +0.4 PCT), EXFOOD/ENERGY +0.2 PCT (+0.1986; CONS +0.1 PCT)
RTRS-U.S. FEB CPI YEAR-OVER-YEAR +2.1 PCT (CONS +2.0 PCT), EXFOOD/ENERGY +1.1 PCT (CONS +1.1 PCT)
RTRS-U.S. FEB UNADJUSTED CPI INDEX 221.309 (CONS 221.20) VS JAN 220.223
RTRS-U.S. FEB CPI ENERGY +3.4 PCT, GASOLINE +4.7 PCT, NEW VEHICLES +1.0 PCT
RTRS-U.S. FEB CPI FOOD +0.6 PCT, HOUSING +0.3 PCT, OWNERS' EQUIVALENT RENT OF PRIMARY RESIDENCE +0.1 PCT
RTRS-U.S. FEB CORE CPI SEASONALLY ADJUSTED INDEX 223.029 VS JAN 222.587
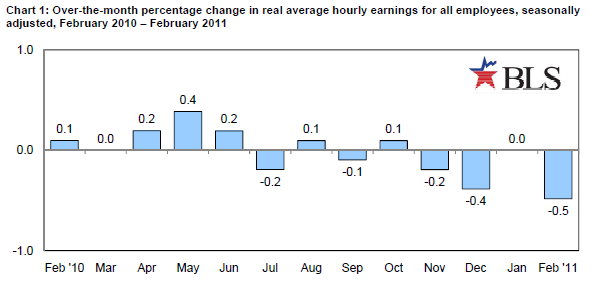
RTRS-U.S.FEB REAL EARNINGS ALL PRIVATE WORKERS -0.5 PCT (CONS -0.3 PCT) VS JAN 0.0 PCT (PREV -0.3 PCT)
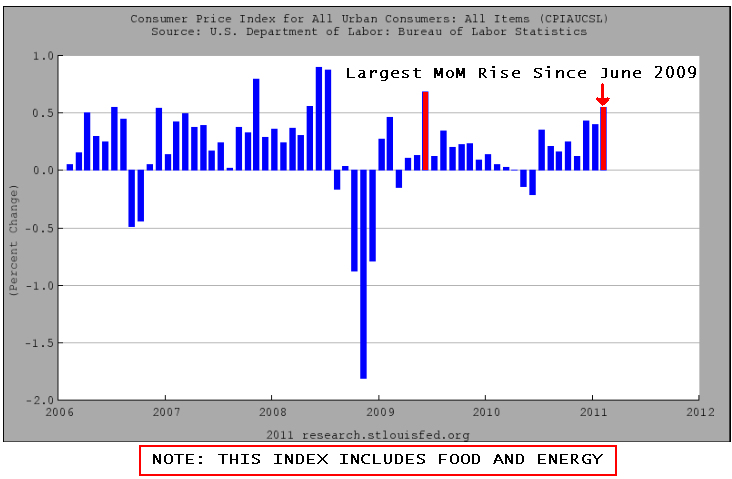
THE HEADLINE GRABBER: INCLUDING FOOD AND ENERGY, THE FEB 0.5 PCT CPI RISE IS THE LARGEST SINCE JUNE 2009 (+0.7 PCT)
Excerpts from the Release...
The Consumer Price Index for All Urban Consumers (CPI-U) increased 0.5 percent in February on a seasonally adjusted basis.
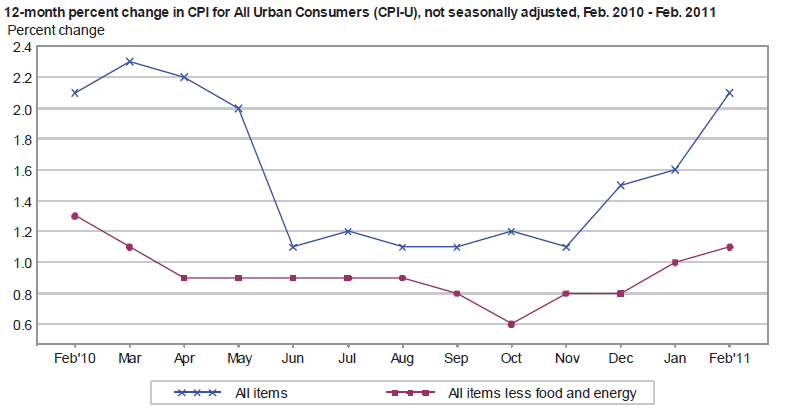
Over the last 12 months, the all items index increased 2.1 percent before seasonal adjustment. The index for all items less food and energy rose in February as well. Most of its major components posted increases, including the indexes for shelter, new vehicles, medical care, and airline fares. The apparel index was one of the few to decline.
The 12-month changes in major indexes continue to trend upward. The all items index increased 2.1 percent for the 12 months ending February; the figure was 1.1 percent as recently as November. The 12- month increase in the index for all items less food and energy reached 1.1 percent in February after being as low as 0.6 percent in October.
Though the seasonally adjusted increase in the all items index was broad-based, the energy index was once again the largest contributor. The 11.0 percent increase in the energy index is the largest since May 2010, while the 2.3 percent rise in the food index is the largest since May 2009.
The gasoline index continued to rise, and the index for household energy turned up in February with all of its components posting increases. Food indexes also continued to rise in February, with sharp increases in the indexes for fresh vegetables and meats contributing to a 0.8 percent increase in the food at home index, the largest since July 2008.
The shelter index rose 0.1 percent in February, with rent and owners’ equivalent rent both also rising 0.1 percent. After declining in January, the new vehicles index rose 1.0 percent in February, its largest increase since October 2009. The medical care index rose 0.4 percent in February after a 0.1 percent increase in January. The index for medical care commodities rose 0.7 percent and the medical care services index advanced 0.4 percent. The index for airline fares increased 2.1 percent in February, its fourth consecutive monthly increase of over two percent. The index for recreation rose 0.3 percent, its second straight monthly increase. The indexes for household furnishings and operations and for used cars and trucks both edged up 0.1 percent in February. In contrast to these increases, the apparel index turned down in February, declining 0.9 percent after increasing 1.0 percent in January.
BLS also released an update on Real Earnings...
Real average hourly earnings for all employees fell 0.5 percent from January to February, seasonally adjusted. This decrease stemmed from a 0.5 percent increase in the Consumer Price Index for All Urban Consumers (CPI-U), while average hourly earnings remained unchanged. Real average weekly earnings fell 0.5 percent over the month, as a result of the average workweek remaining unchanged combined with the decline in real average hourly earnings.
Plain and Simple: Food and fuel prices are still on the rise and consumers including myself are not happy about it. Now core inflation metrics are showing PRELIMINARY HINTS of producers passing along higher costs to consumers. This is not a surprise as retailers said they would do this to maintain profit margins. From a monetary policy point of view, this puts the FOMC in a pickle. Fundamentally, conflict in Northern Africa and the Middle East combined with consistent demand from emerging economies provides enough reason to fret over global supply/demand imbalances (in theory). There isn't much the Fed can do to control headline driven fast$ trading in commodity markets though (herding and momentum), that explains why they told us higher food and energy bills would be temporary. Unfortunately Main Street must now get by with less disposable income....will the margin squeeze lead to less consumer spending in the months ahead? That depends on whether or not hourly wage rates increase. This is a key part of the recovery process. The Fed is hoping higher food and energy prices will lead our productive work force to request better hourly pay. As shared above, wage growth has been nonexistent over the past 12-months and real earnings are suffering. Rising food and energy are squeezing Main Street's profit margins! If food and energy price increases don't slow, without an uptick in hourly wages, spending will suffer unless consumers start leaning on their credit cards again.
READ MORE ABOUT THE MARGIN SQUEEZE
READ MORE ABOUT INFLATION AND THE MONETARY BASE
The bond market is backing up after this news. 10s are 10bps above yesterday's yield lows. The 5-year breakeven inflation rate has widened 10bps from 2.50% to 2.60% and 10-yr breakevens gapped out 5bps to 2.41%.


