After some harrying high volatility moments in the immediate wake of the Employment Situation Report, benchmark 10's have dug in at their best levels since..... since yesterday.
We're just approaching yesterday's opening levels. Still. The generally defensive bias of short sellers in the bond market adds a bit of optimism to the rates outlook. If it is indeed true that bonds are in the midst of a shift in technical tradig bias, from bearish to bullish, it will certainly take an extension of the behavior we witnessed today to confirm it.
Let's take a look at some immediate targets that would help us lean in one direction or another.
The chart below shows where noticeable pivot has developed around 3.49%. This is the inflection level that's whispered words of support in our ear during the darkest hours of the past four days. Breaking and holding that level would be encouraging. After that, 3.46 is our next technical target in 10s.
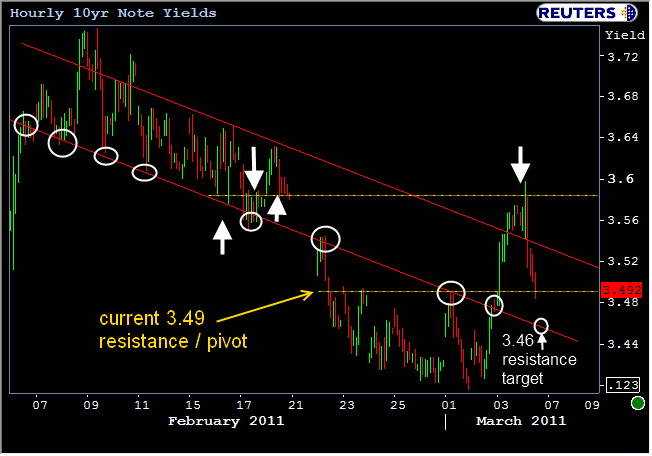
(PLEASE remember that technical lines/studies/trends/etc... DO NOT offer any PREDICTIVE guidance generally speaking. Rather, if we track a trend that continues to prove valid, it is the BREAKING of that trend or the CROSSING of that level that is SIGNIFICANT--but not predictive. It signifies that the current trend is being tested or broken, and that's all we can really know. So please don't see the lower red line and be EXPECTING bonds to rally to 3.46. Rather, note that IF we rally to 3.46 and that line causes some resistance and is subsequently broken or confirmed, then that breaking or confirmation is one piece of evidence that the trend continues to be or is no longer intact)
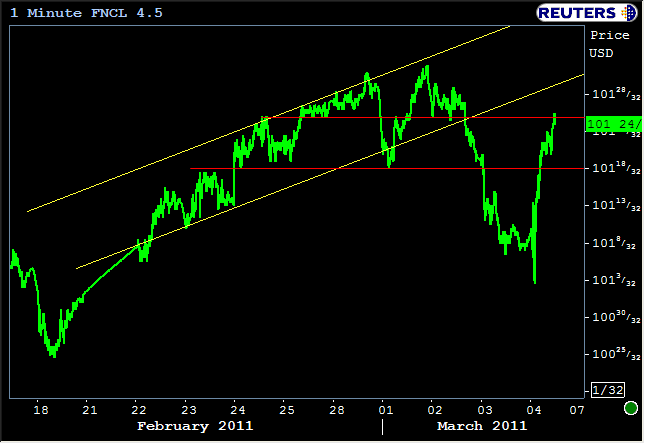
With caveats out of the way, what has been good for benchmarks has also been good for production MBS coupons.
Earlier this week, we noted a highly-traveled pivot point around 101-18. It broke yesterday and was the clearest indicator that reprices for the worse would be widespread. But today, we're back above that price level and testing the next pivot at 101-25.
In the chart below we've called attention to an uptrend, in yellow. We'd need to hit and hold 102-00 today to re-enter that trend channel. It's going to take 102-12 before we see 4.75% C30 buydowns looking more attractive.
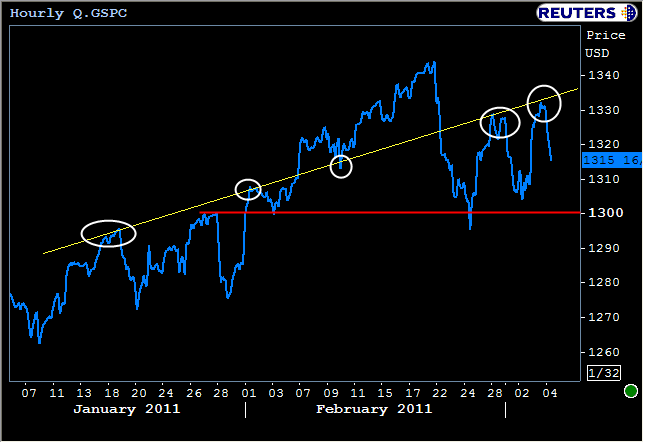
The stock lever has been a friend to bonds lately. But S&P's have yet to confirm a break of their own technical support level.
In the chart below, parallel to the yellow line we've highlighted a red diagonal trendline at 1300. If I'm the S&P, I really want to hold 1300 next week...