First day of a new year and first day back from vacation for many, so we’re supposed to see a nice uptick in volume and activity in order to get a better sense of 2011 trading direction right? Yeh sure. At least when comparing to recent activity, which has been basically dead.
While treasury volume was above average and stocks made fresh multi-year highs, production MBS coupons were illiquid. On several occasions , we saw prices move 2 ticks or more on only one trade —not a common occurrence for TBA markets operating in normal liquidity — and a sign of one way flows aka the profit taking AQ eluded to this AM.
The implication is that we discount today’s movements to a certain extent in MBS and instead rely slightly more on treasuries as a benchmark of broader sentiment. The upside is that lenders still adjust prices based on MBS movements, so even though treasuries were fairly volatile and did little to improve this afternoon, MBS were even less volatile and held an amazingly narrow 4 tick trading range near the highs of the day before going out at the highs in after hours trading.
This was enough to prompt a small handful of lenders to reprice for the better late in the day.
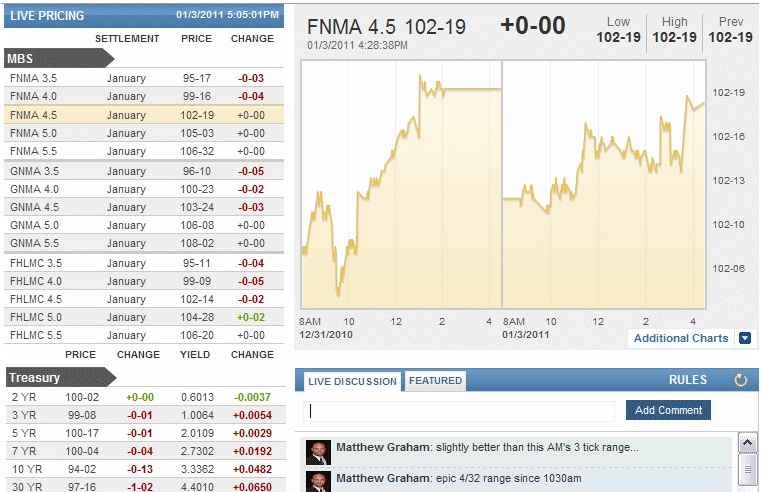
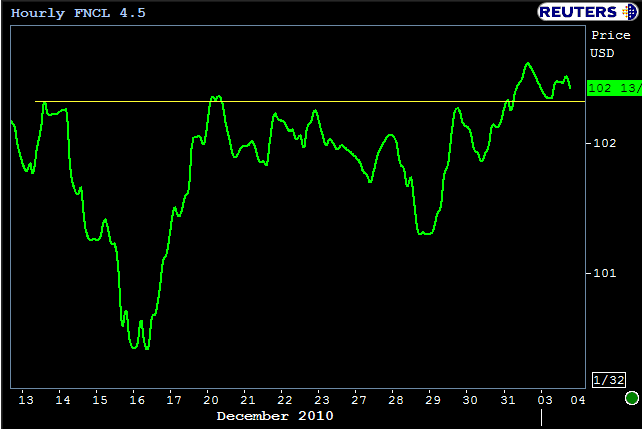
In a slightly broader context, MBS can be seen resting on the high side of a pivot point at 102-10 that had come into play several times in December. Granted, we can’t abide ascribing much technical significance to MBS as they are a spread product, but due to the fact that this particular level has been significant in the recent past, regardless of the underlying reasons, is enough to earn it a mention. If we were to zoom this chart in to a smaller interval, we’d see several “bounces” off support at the 102-10 line this morning.
Treasuries meanwhile were volatile by comparison, moving from last week’s closing levels in the high 3.20’s all the way over 3.40% this morning, returning finally to rest just under 3.34 which is in a band of yields that marks a 62% retracement level for most long term retracement charts. (AQ’s chart marks this at 3.31, and mine at 3.34, just slight differences in personal preference as to the placement of the 0 and 100 retracement limits, thus the “band of yields”).
The other thing that is apparent in 10yr yields is a consolidating range of yields beginning with yield lows on the 9th and highs on the 15th and 16th. The implicit suggestion is that the combined potency of Fed Minutes and the Employment Report this week should be enough to suggest a breakout from this consolidation and send yields moving in one direction or another. Energy is storing as the trend channel consolidates..it is going to be released at some point!
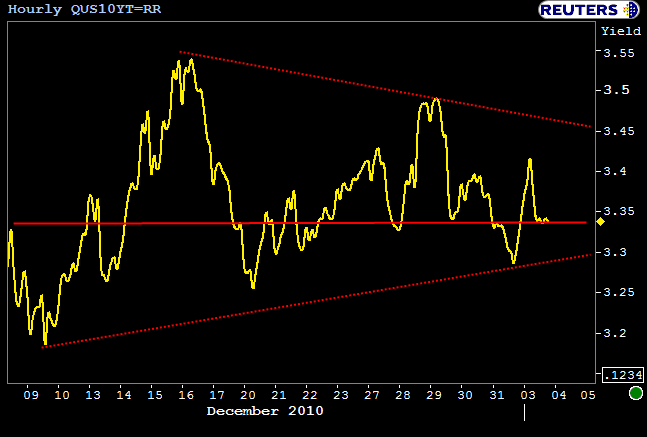
If we see some combination of economically bullish Fed minutes and a better than expected NFP including revisions, yields are more likely to break out to the topside and retest recent highs at 3.50 to 3.56. But in the opposite case, they’d move lower, which would be a “momentum-adding” event with the BOTTOMING OUT that began to take shape in late December.
With the sharp rise in yields over the last month, more than a few market participants are looking for a sign that it is safe to reenter a bullish stance on bonds. Charts such as 10yr futures below can prove, in hindsight, to have been early indicators of this momentum shift.
Circled in red is a candlestick shape known as a “hammer” or “hanging man,” a fairly common candle shape that, taken with other bullish technicals indicated a reversal, or more simply, continued movement in the opposite direction of the candlesticks tail (tail = “wick” for those unfamiliar with candle terminology). This is a bit of stretch but the fact that we’re seeing this hammer on a day where volume has increased (volume bar also got a red circle in the chart below) is at least reason enough to point it out, even if we wouldn’t recommend betting the farm on it.
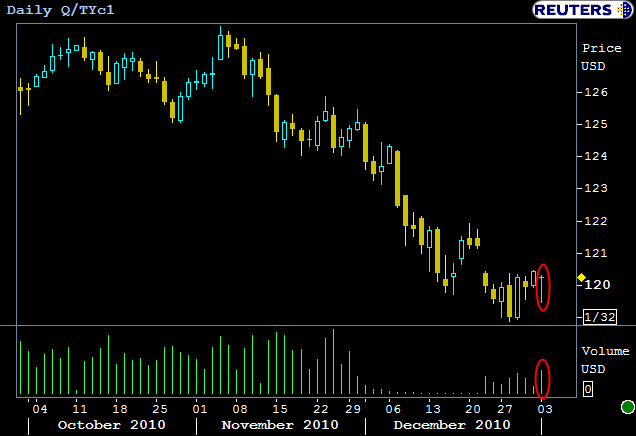
Chart or no chart, it SHOULD all boil down to the big ticket economic items this week (again: FOMC minutes and Employment report). If they’re bond friendly, the above chart will be just another component in a more complete picture of the bond market turning a corner. If they’re bond-bearish, the above hammer formation will fade from memory. Bottom line, it doesn’t mean much by itself, and would only really constitute another feather in the cap of a potential rally that is rooted more appropriately in fundamental developments.


