What began as a bad day for bonds with overnight optimism regarding the Eurozone debt crisis was only made worse by a slew of as-expected or better than expected economic data.
It's given us a good sense of where the market's attention is focused as a vast majority of today's losses came BEFORE ECONOMIC DATA. But rather than aiding bonds in finding support against the Euro-zone-inspired losses, economic data merely fueled the fire, albeit to a small extent, and will likely get more than due credit for that occurrence.
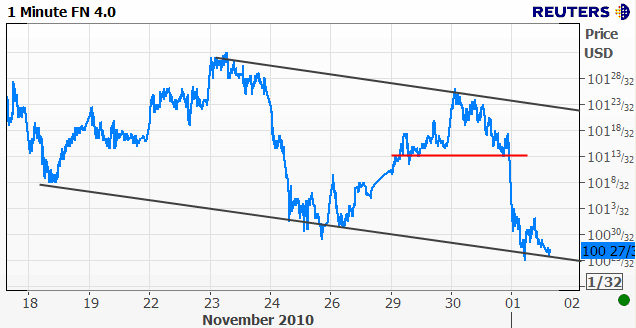
Here's a snapshot of MBS and Treasuries at the moment.
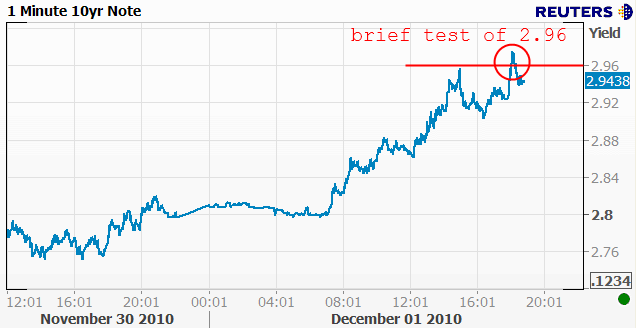
There's that 2.96 level again. It keeps getting attention because those have been the highest yields seen since earlier this month, and before that, July. You can actually see TWO touches earlier this month, a fact that lends some technical credence to 2.96 as a support level.
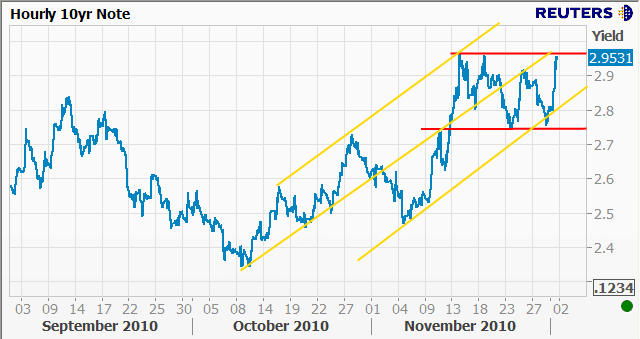
In the context of the following chart, there's still some hope for today's losses amounting to another violent pitch in the long and storied road of the QE2 cleansing process. the red lines show the post QE2 range and the yellow lines show the uptrend in yields with a lot of technical touches along an internal trendline at the midpoint of the trend. That internal trendline provides support even if yields rise above 2.96, and that's within our scope of possibilities. The post-QE 2 months could easily reach 3.07-ish and still adhere to an ultra-long-term bullish trend.
To illustrate the comparative underperformance by MBS today, a similarly long term chart shows FN 4.0's not holding their ground at recent november lows, but in fact at their lowest levels in 7 months.
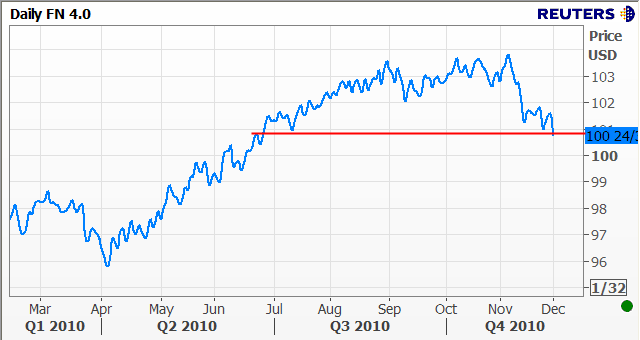
As far a technicals go, even us MBS guys agree that benchmark-type securities like treasuries are head and shoulders above spread products like MBS, so from a strategic standpoint we're much more interested in the battle at 2.96 in treasuries than with MBS making 7 month lows.
Similarly, we might look at stocks with respect to last night's musings about the reconnection of the stock lever and/or economic data. While we do, of course, see a huge rally in stocks, it bears all the mentioning in the world that S&P futures had risen 15 points BEFORE econ data came out. So what I see in the following chart is a stock market that had reason to rally and reason to confirm or even extend that rally, but that is, as yet, unwilling to break through the next technical ceiling at 1205.
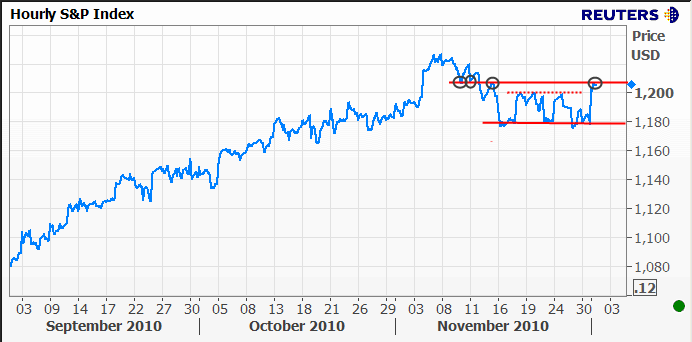
Bottom line, a 10 pt gain from the opening bell is not a rampant stock surge. It's a measured rally to an accepted technical level and it waits, just as the bond market waits, for the coming days to either suggest a continuance or a reversal of its recent moves. In other words, with a 10yr treasury note STILL around or under 2.96, it's still very much anybody's game until NFP has it's say, which may or may not already be baked in (?). Keep in mind, that's from a strategic/long-term standpoint. I think the risks that NFP exacerbates current loan pricing problems is a major consideration and in a tactical/short-term sense, I'd be turtled-up waiting for a safer moment to explore the world beyond the safety of my shell.


