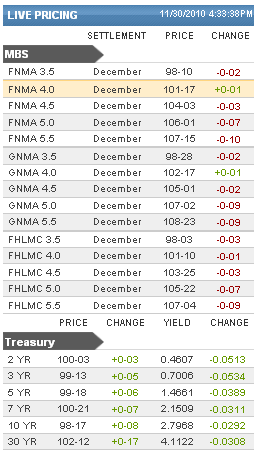
Yesterday, the last price to come across our screens for Fannie 4.0's was 101-16. So I suppose the fact that today's last price was 101-17 should be taken as a "win" on the day, but it doesn't necessarily feel that way.
If we're using sporting analogies, one might say that bonds blew a big lead today. Granted, "big" is relative to the day's range as the highest prices reached by 4.0's this morning were around 101-26. At their worst, those levels were around 101-13, crawling 4 ticks back for the 101-17 close. Note that the supportive bounce at 101-13 coincides with yesterday's lows (clue 1 that we'll soon be discussing intraday pivots )
Treasuries are also ending the domestic session in roughly the same place as they began the domestic session, just under 2.80 (funny, I feel like someone around here mentioned 2.80 early in the day). At their best levels today, yields reached as low as 2.75, and backed up to touch 2.82 during the selling, matching the high yield marks from the overnight session, and the low yield marks from yesterday. Here is a recap of closing marks....
In fact, since we've been relentlessly harping on INTRADAY PIVOTS during the uncertain trading conditions inherent to the CLEANSING PROCESS, the market continues to offer up perfect examples of this. Example? In the chart below, note yields skid to a brutal halt at 2.82 yesterday (11/29). That yield level offers the first instance of major resistance to a spikey afternoon rally, and then holds firm on the second approach (red circles). What would make this an intraday pivot? If that yield was broken and then turned out to provide support for the next day! And of course, this is evident in the yellow circles.
So in case all this talk about intraday pivots was fuzzy in your mind, there's a great example. But the phenomenon is so much more pervasive than to be relegated to the 2 day affair seen at 2.82 above. In fact, there are numerous adjacent "hang outs" for bond yields that have nominated themselves for consideration by demonstrating their propensity to offer resistance when yields approach from above and support when yields are rising to meet them.
Moving to a slightly wider view, we see similar behavior on a different scale. The following chart shows the 2.8 and 2.75 pivot points. (incidentally, it's also a great chart to discuss 2.85 and above, but I see those pivots as more of a moving target, sloped slightly downward, whereas 2.8 and 2.75 have been decidedly more horizontal. (in tech-terms, a "descending triangle" beginning with highs from the 16th and colliding eventually with resistance from 2.75).
Regardless of the technical terms through which we try to make sense of the market, in the most basic sense, it's plain to see that the market is, for lack of a better term, SIDEWAYS. Of course, there is plenty of volatility, but what we're looking at is a market that is not exactly sure where it's going, or if it does know where it's going, it may not know WHEN. Want more sideways? It's not just treasuries exhibiting indecision. Take a look at S&P candlesticks
So let's talk about the caption in the last chart. "Entertaining reconnection" etc... Things have been relatively disconnected recently, but we've seen markets in general show more and more interest in moving in directions suggested by data and thus a bit of the normal relationship of the stock lever has come into play. We're especially interested this week to see how much that trend might continue. It will be telling to see if data will matter much before NFP on Friday, or if more esoteric Eurodrama will continue to pull strings behind the scenes. (READ MORE)
If we do see a reconnection to data and movements OUTSIDE the aforementioned ranges, then we'll have a suggestion that all the struggle we've been watching between the bulls and bears (READ MORE) has been more akin to an exhibition game whereas the regular season is about to start.
Tomorrow, the econ calendar picks up the pace with another metric ton of econ data including ISM Manufacturing data, generally regarded as the star of tomorrow's show. There are several components of the report garnering interest from economists, but particularly, the employment component of the report will be closely watched as a potential indicator, in conjunction with ADP employment numbers (also tomorrow morning) for Friday's NFP. Bottom line, NFP is always a market mover, and tomorrow morning's data is often interpretted with an eye to NFP, so if we see strength in that data, it could rapidly translate to weakness in bonds. At that point, the battle between bulls and bears gets epic as 10yr notes will be defending the castle at the gates (those higher red lines). On the other hand, crappy data MIGHT be enough to rally the troops through the front lines at 2.75, but neither side will occupy the other side's territory long without blessing from king NFP.


