Because lenders were on autopilot after Thanksgiving, I decided to run my loan pricing comparison vs. rebate offers from last Wednesday, which was not a pleasant trading session for mortgage rates.
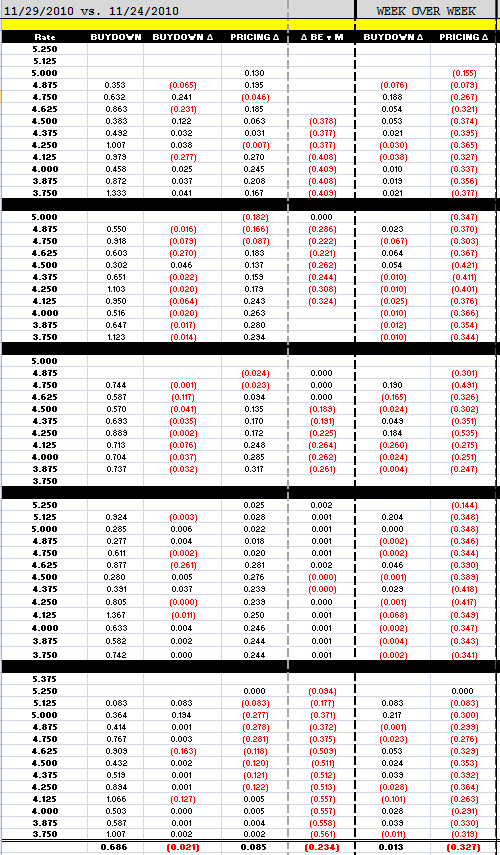
On average, rebate is 8.5bps better than it was last Wednesday with the largest improvements seen in the note rates closest to par. Week over week comparisons shine some light on just how bad last Wednesday was for us, rebate is 32.7bps worse than it was last Monday. Lenders did not discriminate though, they whacked prices across the stack, not just the closely watched par notes. Best execution for a well-qualified, no LLPA borrower is 4.50%. These consumers could possibly be quoted 4.25% at 1+1 but buydowns aren't worth the extra closing costs.
For example, the 4.25% buydown at the first lender in my loan pricing model comparison below costs 1.007 points. On a 250,000 loan that buydown would add $2,517.50 to closing costs. The monthly savings when floating down from 4.375% to 4.25% on a 250,000 loan is $18.36. Thus it would take the borrower 137 months to recover the points they paid at closing to float down to 4.25%. That's 11.4 years. See what I mean when I say "buydowns aren't worth the extra closing costs"? We really need to 3.5s to trade again or 4.25% won't be worth it to borrowers.
If you're wondering why rebate looks a little weak relative to MBS price appreciations, look no further than the Δ BE v M column. There's 23.4 extra bps baked into rate sheets today, on average. Seems like lenders don't want originators locking loans today doesn't it?
EXPLANATION OF LOAN PRICING COMPARISON
Buydowns are the cost of floating down to the next lowest note rate. Buydown costs are matched to the note rate in the same row. For example, the first number in the buydown column is 0.353%, this is the cost to float down from 5.000% to 4.750%, as a percentage of the loan amount (bc they are priced the same!). This is important because it helps an originator determine the best execution rate/points combination for a borrower who has a good idea of how long they intend to keep their mortgage (breakeven on points paid vs. monthly payment savings). In the Buydown Delta column, red is cheaper. Black is more expensive.
The pricing change column is a direct rebate comparison of pricing today vs. pricing yesterday. Red is worse. Black is better.
The Δ BE v M column shows you how margin is changing. Red means more margin. Black means less bps are baked into pricing.
--------------------------------------------------------------------------
4.50%, 4.25%, and 4.00% pricing quotes are below their 5, 10, and 30 day averages. Combine that with all the negativity discussed above and....
Plain and Simple: It's not a great day to lock a loan.
Market Update...
10s tested 2.85% support with success. The 10yr note is currently +11/32 at 98-07 yielding 2.831%. The December FNCL 4.0 is +10/32 at 101-17. The January FNCL 4.0 is +10/32 at 101-05. This is an intraday price high for both Fannie 4.0s coupons. These price appreciations do warrant a reprice for the better but I am not holding my breath. Let me know if your lender decides to recall rate sheets....


