We're long overdue a look at loan pricing....
Day over day, on average, rebate improved by 10.1bps and buydowns are 1.7bps better. The largest pricing improvements today were seen in the note rates closest to par, but take note of how expensive it got to buydown the consumer's rate from 4.375% to 4.25%. Upwards of 85bps at all five of the majors. Yikes! Assuming the buydown was 85bps on a $200,000 loan, the breakeven on that is 9.6 years. THAT'S REALLY EXPENSIVE!!!
Rising permanent buydown costs on the note rates closest to par reflect the fact that FNCL 3.5s got smashed by extension risk this week. It's safe to say the FNCL 3.5 lost its status as production coupon early last week. This will be illustrated in the 4.00% and 4.25% note rate charts below.
On a week over week basis, the loan pricing pain is more obvious, 89.9bps! Check out how large the rebate reductions are in the note rates used to fill 3.5 MBS coupon trades. 4.375% is now borrower best execution on a 30 year fixed loan.

EXPLANATION OF LOAN PRICING COMPARISON
Buydowns are the cost of floating down to the next lowest note rate. Buydown costs are matched to the note rate in the same row. For example, the first number in the buydown column is 0.426%, this is the cost to float down from 5.000% to 4.750%, as a percentage of the loan amount (bc they are priced the same!). This is important because it helps an originator determine the best execution rate/points combination for a borrower who has a good idea of how long they intend to keep their mortgage (breakeven on points paid vs. monthly payment savings). In the Buydown Delta column, red is cheaper. Black is more expensive.
The pricing change column is a direct rebate comparison of pricing today vs. pricing yesterday. Red is worse. Black is better.
The BE v M column shows you how margin is changing. Red means more margin. Black means less bps are baked into pricing.
--------------------------------------------------------------------------
Ok so now I am gonna do something I don't usually do...
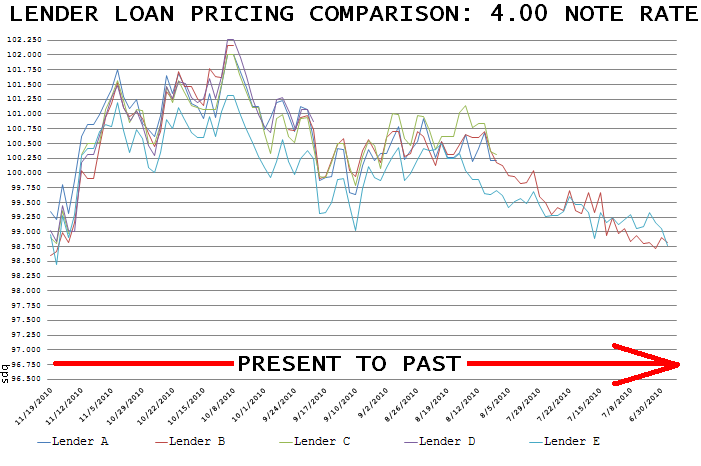
I have charted loan pricing on 4.00%, 4.25%, and 4.50% note rates going back to late June. Loan officers you know what you're looking at here, consumers these charts won't make much sense to you but that's OK because these charts are not intended for you. They are intended to help loan officers get an idea of where we've been over the last 6 months or so.
NOTE: Read the chart left to right. Present to Past.
30 year 4.00 note rate pricing is at 5-month lows but take note, these quotes weren't even available in early August. All five of the lenders in my model are still offering 4.00%, but like I said above, the buydown costs are expensive! 4.00% rates experienced the largest nose dive out of the group. The best time to lock in a 4.00% note rate was mid-October.
4.25% is still above par but we're right on the edge of going underwater. Just like 4.00% note rates, the rebate decline was fast and furious after the Employment Situation Report was released two days after the FOMC announced QEII. We're at 5-month lows, the outer limit of our loan pricing range. The best time to lock a 4.25% note rate was early October.

4.50% didn't fall as far as 4.25% and 4.00% but the decline was still precipitous. The best time to lock at 4.500% was early October.

THOUGHTS? FEEDBACK? TMI? WANT ME TO PRESENT THIS INFO ANOTHER WAY?


