Bonds continue to rally and/or hold their ground despite a neutral to bullish retail sales report as well as rallying stocks. This is a potential confirmation of the "trader's world" dynamics discussed earlier today. In other words, bonds are foregoing their connection to econ data and the stock lever in favor of tradeflow considerations.
Including the auto sector, Retail Sales landed 1.2% up vs. a forecast of a 0.7% gain. Excluding autos, the report stood at an expected +0.4%. That data, among other things, has ushered stocks moderately higher this morning with the S&P up 6.7 points at 1205.
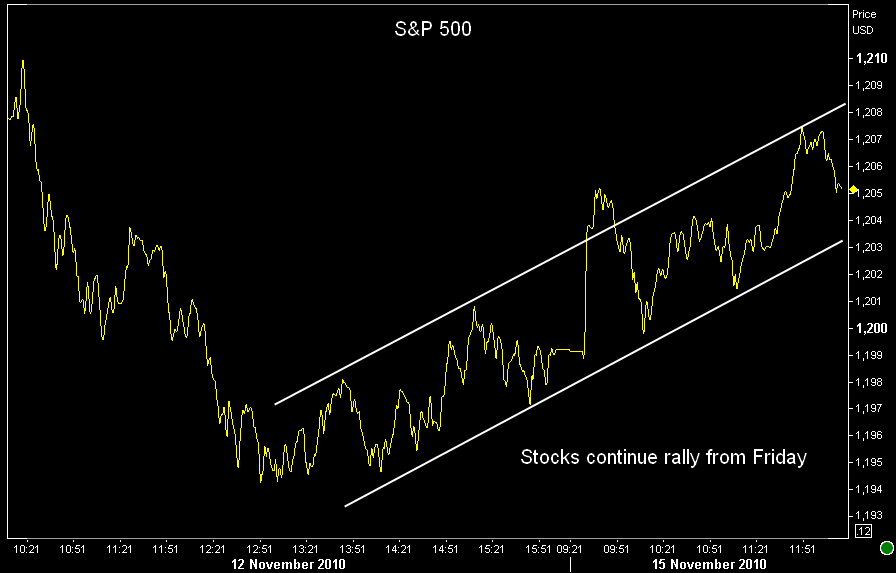
But unlike the more common scenario for a stock rally, bonds are continuing to rally as well.
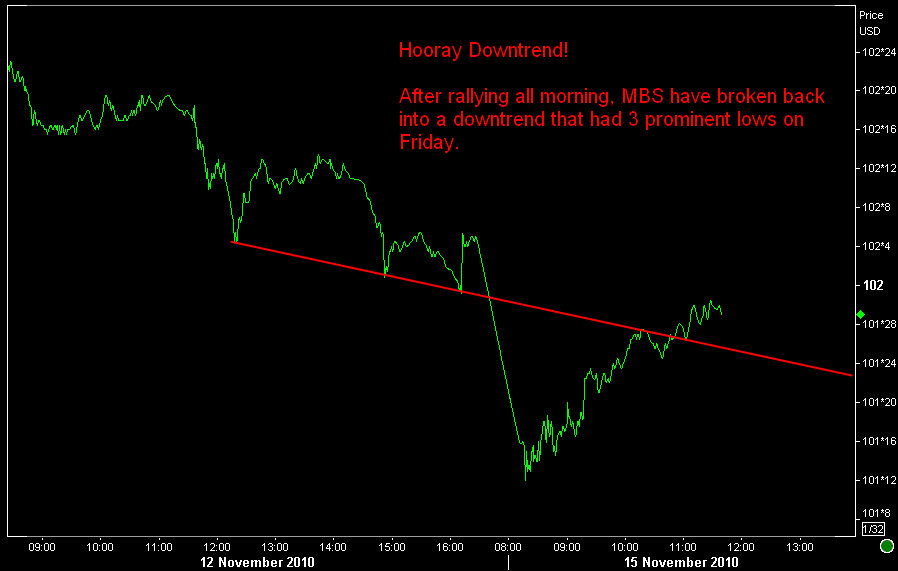
And as the broader bond markets catch their breath, MBS is an expected beneficiary. 4.0's seen in the chart below are back in line with a downtrend from Friday. Of course downtrends aren't what we're looking for, but in this case, it's a decent alternative to the cliff-diving from this morning. So "hooray downtrend?"
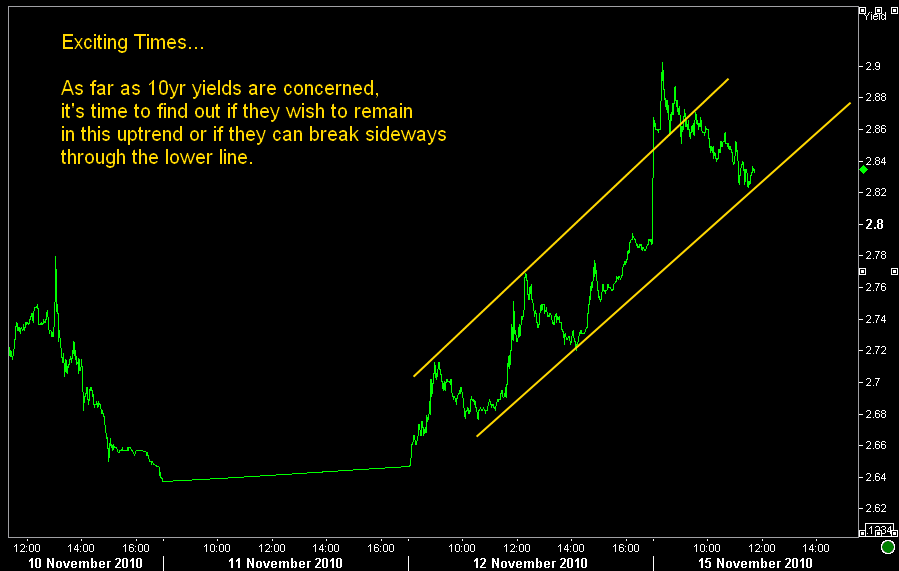
Despite the fact that bonds stood a good chance to hold their ground after their fall this morning, we're far from being able to count on a steady march to victory. Beyond the obvious questions to be answered about how the recent legislative uproar to "end QE2" might play out, ongoing econ data, Euro-drama, etc..., there are some technical levels that need to be held or broken in order to make further assumptions about the impending direction of rates. In the short short term, there is an UPtrend in 10yr yields that is right this moment, in the process fo being tested. Break = Good, Hold = absence of good.
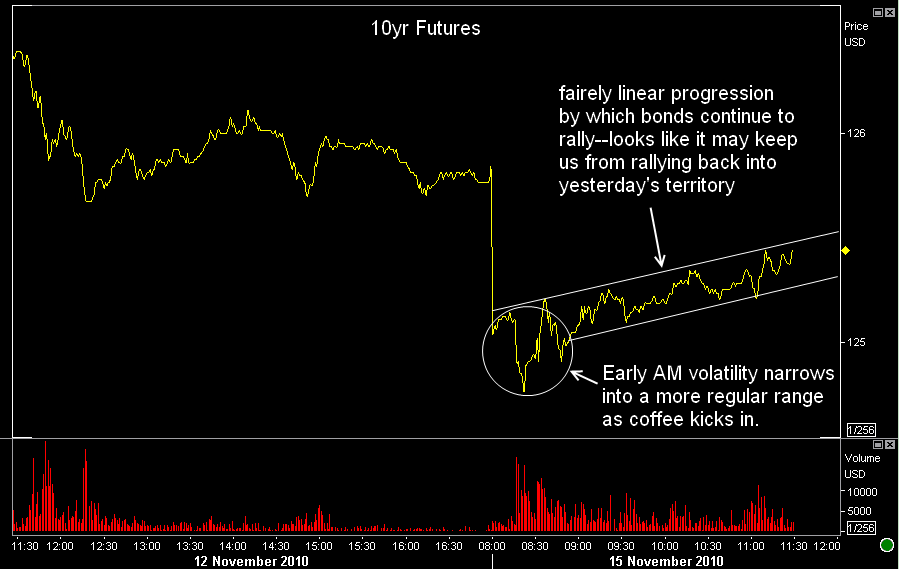
Perhaps the most interesting level to watch as far as technically-based lock triggers is seen in 10yr futures below. Of course any time we talk about basing lock triggers on something other than MBS, it's implicit that MBS should be moving in mostly direct proportion to the instrument in question. But even if they're not moving in lock-step, it's still in the best interest of MBS for 10yr futures to stay above the line seen in the chart below.
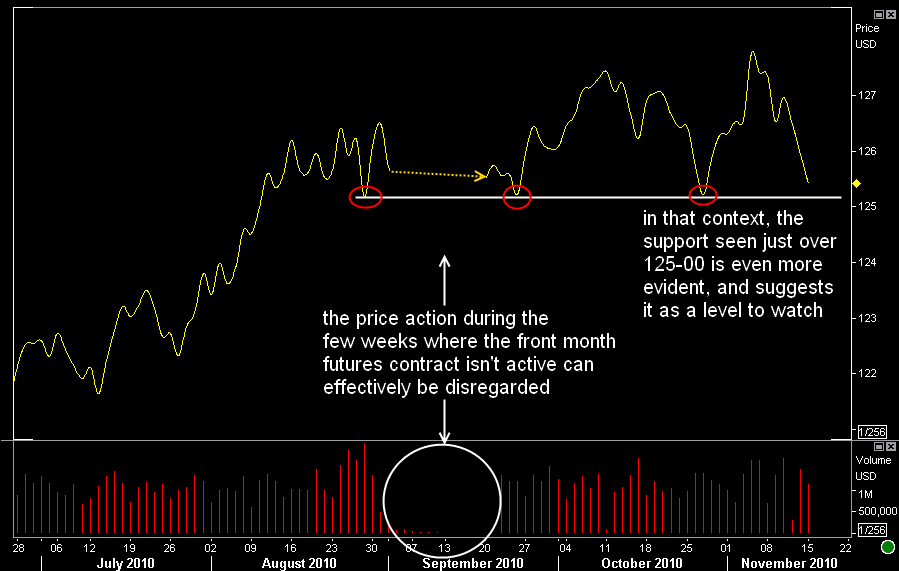
Keep in mind when you're looking at this chart that the yellow line had been crossing the white line this morning, but since this chart is marked only once per day, all it had to do was get above the white line by the end of the day, which it is at the moment. If it holds above the line, it's just another vote for bond-bulls to step back from the ledge. And if it breaks, I'd probably be watching MBS closely to see if the general shape of the MBS price chart matched futures in the previous hours and days.


