10AM data is out. So much for a strong Chicago PMI number yesterday....
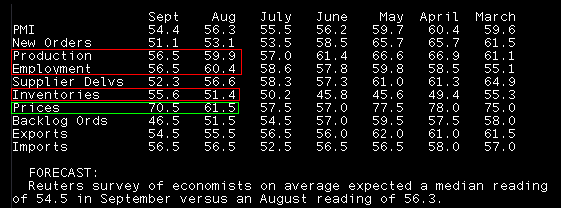
ISM came in on the screws but worse vs. the August print and the lowest read since November09. New orders and production declined, but inventories rose. I don't see this as a positive, I see it as businesses not finding enough consumers to buy their products; now inventory is accumulating on shelves. This is speculation though and needs to be confirmed with a continued diversion between new order/production and inventories.
In terms of the Fed's two focuses, employment and inflation...the employment index fell to it's lowest level since March but remains in positive territory. Prices rose significantly. The fundamentals of a weaker, but still positive, read on the employment are clear but the move higher in producer price levels is not. At first glance, the rise in producer prices (raw materials, probably not labor) should serve to discount the chances for QEII, but I am not convinced. We've experienced a run of cost push inflation in the past (remember $4.00 gas prices?) and instead of paying the higher prices, consumers sold their SUVs and switched to more fuel efficient cars. This is not the only example, we've seen throughout the course of the great recession, producers have not been able to pass along higher COGS to consumers. It's all about the bargain and China can produce goods much cheaper than we can. In the big picture I see this as a reason to believe profit margins will shrink unless companies perform another round of cost cutting.
Plain and Simple: On the surface the rise in inventories and reduction in production and new orders looks like a problem, but we need to see how that metric plays out over the next few months before we make any grandiose assumptions. The employment index was lower but remains in positive territory, although it's the lowest read in 6 months. Price levels spiked higher which is a sign of potential consumer level inflation to come, unfortunately it remains doubtful that producers will be able to pass these higher costs down to consumers. Ugh. The Fed is in a tough spot...
RTRS-ISM REPORT ON U.S. MANUFACTURING SHOWS PMI AT 54.4 IN SEPTEMBER (CONSENSUS 54.5) VS 56.3 IN AUG
RTRS-ISM U.S. MANUFACTURING PRICES PAID INDEX 70.5 IN SEPTEMBER (CONSENSUS 60.0) VS 61.5 IN AUG
RTRS-ISM U.S. MANUFACTURING EMPLOYMENT INDEX 56.5 IN SEPT VS 60.4 IN AUGUST
RTRS-ISM U.S. MANUFACTURING NEW ORDERS INDEX 51.1 IN SEPT VS 53.1 IN AUGUST
Remember: A read above 50 = economic expansion. A read below 50 = economic contraction. We're still in the green across the board, growth just isn't as fast as many, including the Fed, had hoped it would be.....
Final Consumer Sentiment flashed at 9:55.
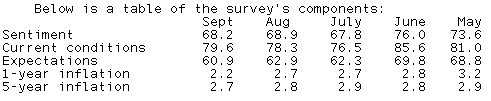
Plain and Simple: The final read for September improved 2.2 points to 68.2 from the preliminary print. This beat forecasts. Consumer expectations also improved and beat, but remain low on a relative basis On the inflation front, in the table below you can see how consumers are becoming increasingly more nervous about the prospects of disinflation and deflation, especially in the next year. Chalk one up for more QEII. Yes it's really all about that...
RTRS-THOMSON REUTERS/U. OF MICH US CONSUMER SENTIMENT FINAL SEPT 68.2 (CONSENSUS 67.0) VS PRELIM SEPT 66.6
RTRS-THOMSON REUTERS/U. OF MICH CURRENT CONDITIONS INDEX FINAL SEPT 79.6 (CONSENSUS 78.9) VS PRELIM SEPT 78.4
RTRS-THOMSON REUTERS/U. OF MICH CONSUMER EXPECTATIONS INDEX FINAL SEPT 60.9 (CONSENSUS 60.0) VS PRELIM SEPT 59.1
RTRS-THOMSON REUTERS/U. OF MICH 12-MONTH ECONOMIC OUTLOOK INDEX FINAL SEPT 61 VS PRELIM SEPT 59
RTRS-THOMSON REUTERS/U. OF MICH 1-YEAR INFLATION OUTLOOK FINAL SEPT 2.2 PCT VS PRELIM SEPT 2.2 PCT
RTRS-THOMSON REUTERS/U. OF MICH 5-YEAR INFLATION OUTLOOK FINAL SEPT 2.7 PCT VS PRELIM SEPT 2.8 PCT
RTRS-THOMSON REUTERS/U. OF MICH CONSUMER EXPECTATIONS INDEX LOWEST SINCE MARCH 2009
Last but not least, construction spending rose 0.4% in September.
Market Reaction....
Bill Dudley's dovish comments are still the primary focus of the bond market, but 10am helped move the needle in an originator friendly direction.
Stocks fell from session highs to session lows, a 9 point swing in the S&P as sell tickets simultaneously hit screens. S&Ps are currently +1.50 at 1138.25.
Benchmark 10s rallied back to level on the day. Currently the 10yr TSY note is UNCH at 100-31 yielding 2.513%.
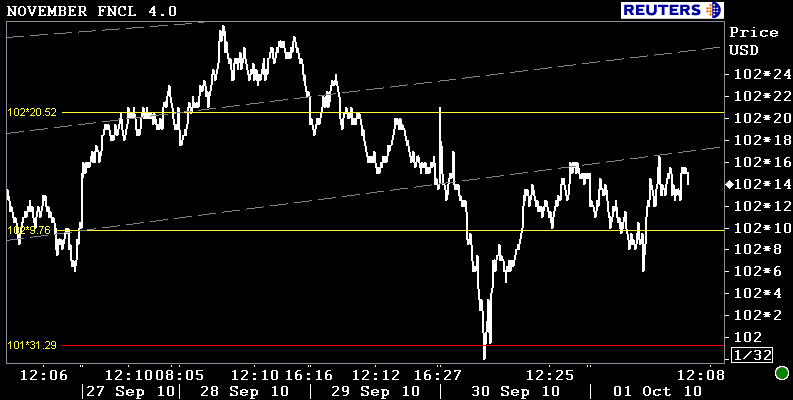
After hitting an intraday low of 102-06, the November delivery FNCL 4.0 is now UNCH at 102-15. Yield spreads are wider into the TSY rally. The November FNCL 4.0 continues to run into resistance at our outer internal trendline....
If your lender published pricing early this AM, you should see some reprices for the better.


