The Treasury just auctioned $16 billion 30 year bonds. The results were interesting to say the least....
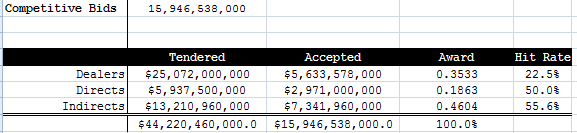
In terms of demand, the bid-to-cover ratio was 2.77 bids submitted for every one accepted by Treasury and the high yield tailed WI by 1bp on my screens. While that's a healthy bid to cover ratio, when you judge demand based on the auction's high yield, the expensive nature of this issue is obvious as it appears dealers were scrambling to build in whatever concession they could following a strong morning for the way long end of the yield curve (benefited from curve flattening trades this AM)
Dealers added a meager 35.3% of the competitive bid. That is at least a 2-year low for dealer participation in a 30yr auction. Directs were awarded 18.6%, this is below the short run average but still above the long term average. Indirect bidders were BIG BUYERS of the long bond, taking home 46% of the issue and 55.6% of what they bid on.
Here is a recap of the auction takedown:
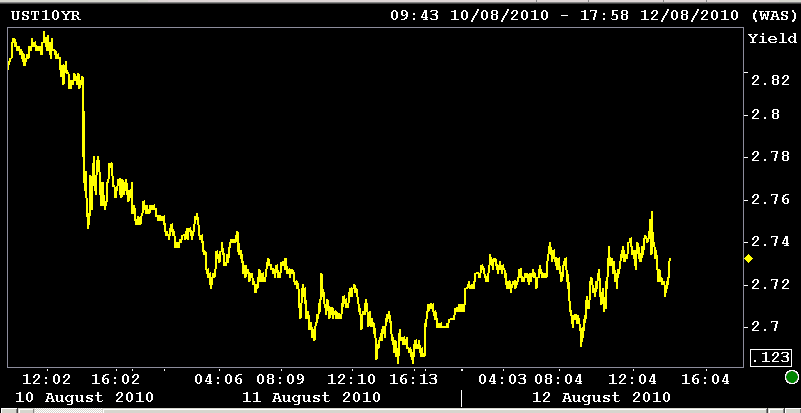
The 10 year note yield rose steadily into the auction (the other side of flattening curve trade vs. long bond) but came off session highs after the results were released. The 2.625% coupon bearing 10-year note yield is currently 4.3bps higher at 2.733%. 2s/10s are holding steady at 219bps.
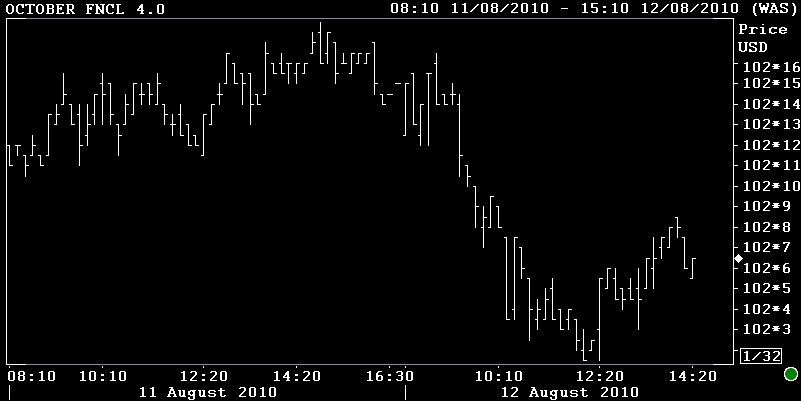
Rate sheet influential prices are still in the red but mortgages are coming off the yield spread wides of the day as benchmark's back up (10yrIRS almost out of negative territory). The October FNCL 4.0 is -0-09 at 102-06 and the FNCL 4.5 is -0-10 at 104-01.
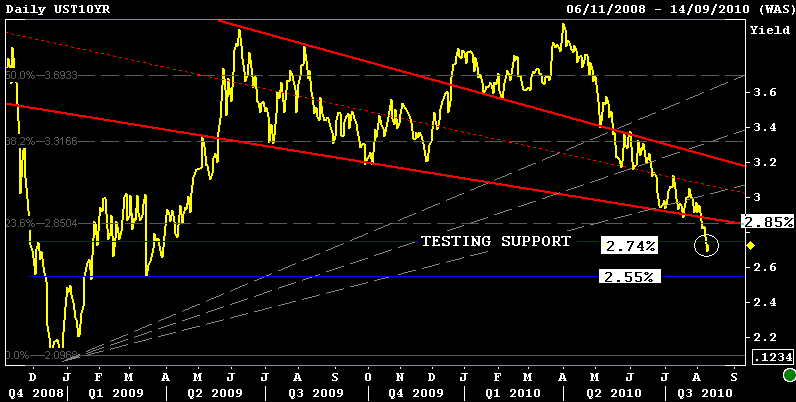
Reprices for the worse are unlikely at the moment but I expect to see a retest of the recent interest rate rally in the near future. This might not occur today, it might not happen tomorrow, but eventually this bull flattener will be faded and the market will look to confirm the extent to which yields have declined in such a short period of time.
REMEMBER: Trading flows are thin and activiy is reflective of a summer session (decision makers out of office). This means price action could get choppy...and if sellers do take over, the direction of that choppy price action would be unfriendly to an originator.
It's all about the bond market right now and there's a lot of duration out there. If the curve starts to steepen, run for cover. Your first sign of ALERT is if 10s break 2.745% support. If steepener flows pick up, we could see 10s run all the way back up to 2.85%. If enough new long positions have been opened and the falling knife is caught quickly, the blue range is where I would expect 10s to trade in the near term.
READ MORE ABOUT YIELD SPREADS AND THE SHAPE OF THE YIELD CURVE


