Upon inspection, it looks like loan pricing is more aggressive today than it was last Wednesday. Are my spreadsheets lying to me or is that an accurate observation?
If you're seeing the same thing, then rate sheets are probably pretty stinkin close to lifetime bests (low rates and points). AT LEAST SINCE THE SECONDARY MARKET WAS FORMED...
Best efforts offerings---of lenders who I would consider "major"---are on average 10bps better today. While this seems small compared to the day over day gains seen last Wednesday, improvements were most significant in the cluster of note rates surrounding par. Plus, from a points paid breakeven perspective, it's now cheaper for borrowers to float down to lower rates (rate buydowns cheaper).
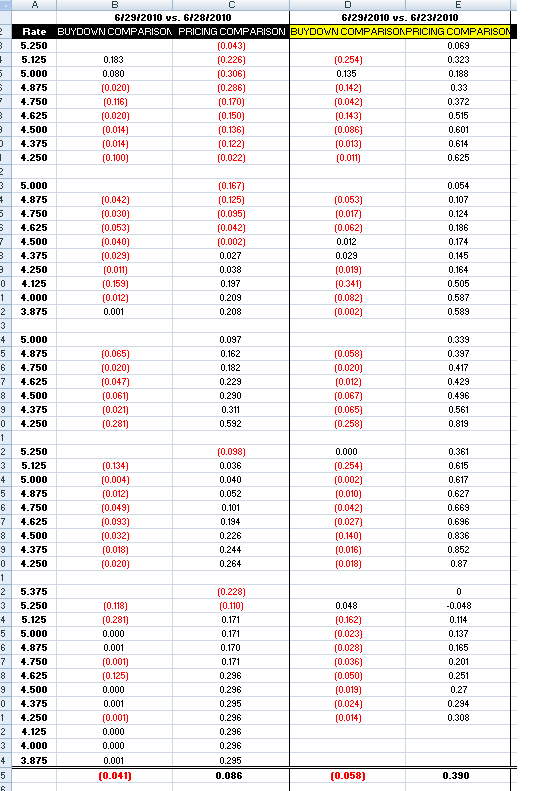
Below is a screen shot of my BestEx spreadsheet. This is one of those situations where too much info can be a bad thing, so rebate has been removed from view. As you can see, one lender actually weakened offers today. Their pricing is still very aggressive though. GMAC continues to buy the market (good call Rodney) and has even made it possible for a borrower to close with a 4.00% mortgage rate (expensive buydowns!).
RED buydown means cheaer
RED pricing comparison means pricing is worse
The pricing I study is basically a benchmark for every rate sheet you see...except retail pricing.
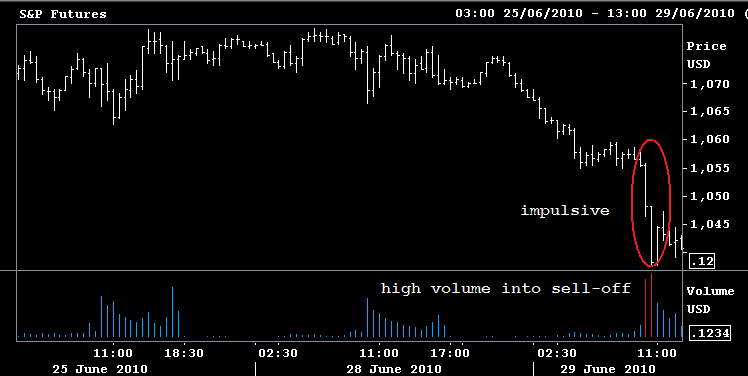
The improvements were made possible by a breakdown in stock futures, a flight to quality into good 'ol BENCHMARK TREASURIES, and liquidity in the 4.0 MBS market (willing buyers and able sellers).
Led by industrials, financials, and consumer discretionaries.....the S&P is -2.58% at 1047.15. The first layer of support at 1050 has been broken...in an impulsive manner.
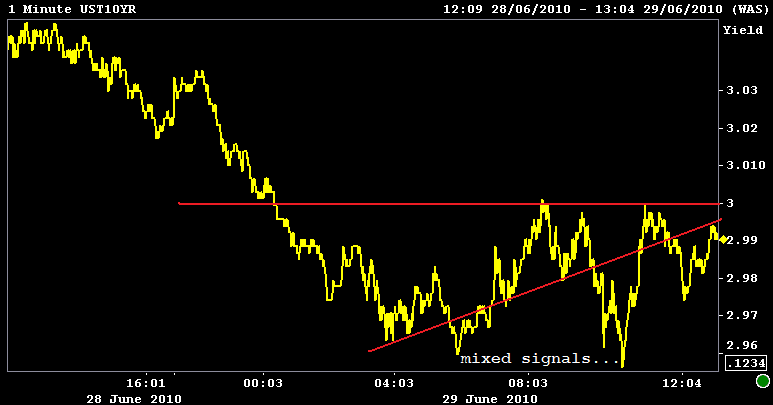
REMEMBER: 1040 is a pivotal support level. A sustained breakdown of this support level could lead 10s down to 2.85%. (Still not ready to trade 3.5s...unless the Fed is buying MBS)
Duration is still in style (some seriously short hedge ratios out there) and the rate sheet influential end of the yield curve is rallying. The 2s/10s curve is 2bps flatter. The 10yr TSY note is 3.1bps lower at 2.992%.
The strength of the move below 3.00% is however being re-tested by the markets...
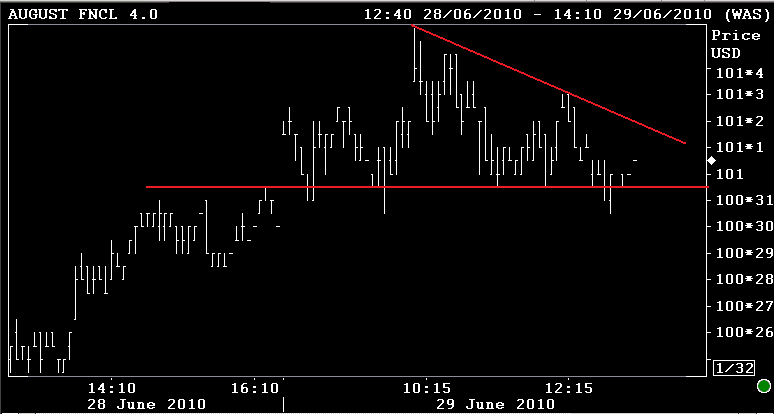
The August delivery FNCL 4.0 is +0-02 at 101 the figure and the August FNCL 4.5 is UNCH at 103-12. The secondary market current coupon is 1bp lower at 3.82%.
I would expect the descending triangle to consolidate into the close. If S&Ps retain weakness, reprices for the worse should not be an issue. If S&Ps bounce, the FNCL 4.0 would first look to test 100-28.0