830AM data has been released. Both jobless claims and durable goods orders were generally better than expected but not far from consensus estimates. Stocks rallied and rates moved higher after the releases. Here is a recap of the data...
UNEMPLOYMENT INSURANCE WEEKLY CLAIMS REPORT
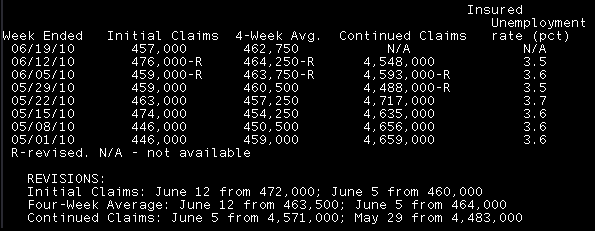
In the week ending June 19, the advance figure for seasonally adjusted initial claims was 457,000, a decrease of 19,000 from the previous week's revised figure of 476,000. The 4-week moving average was 462,750, a decrease of 1,500 from the previous week's revised average of 464,250.
The advance number of actual initial claims under state programs, unadjusted, totaled 421,104 in the week ending June 19, a decrease of 23,066 from the previous week. There were 568,552 initial claims in the comparable week in 2009.
08:30 24Jun10 RTRS-US JOBLESS CLAIMS FELL TO 457,000 JUNE 19 WEEK (CONSENSUS 460,000) FROM 476,000 PRIOR WEEK (PREVIOUS 472,000) BETTER THAN EXPECTED
08:30 24Jun10 RTRS-US JOBLESS CLAIMS 4-WK AVG FELL TO 462,750 JUNE 19 WEEK FROM 464,250 PRIOR WEEK (PREVIOUS 463,500)
08:30 24Jun10 RTRS-US CONTINUED CLAIMS FELL TO 4.548 MLN (CONSENSUS 4.560 MLN) JUNE 12 WK FROM 4.593 MLN PRIOR (PREV 4.571 MLN) BETTER THAN EXPECTED
08:30 24Jun10 RTRS-US INSURED UNEMPLOYMENT RATE FELL TO 3.5 PCT JUNE 12 WK FROM 3.6 PCT PRIOR WK (PREV 3.6 PCT)
Advance Report on Durable Goods Manufacturers’ Shipments, Inventories and Orders May 2010
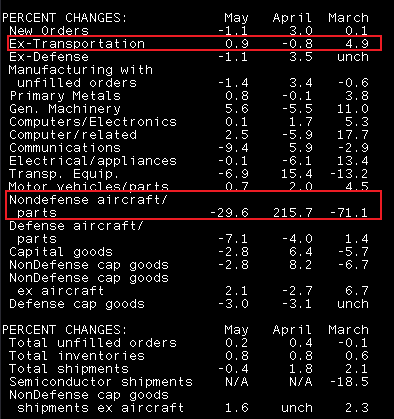
New orders for manufactured durable goods in May decreased $2.2 billion or 1.1 percent to $192.0 billion, the U.S. Census Bureau announced today. This decrease followed five consecutive monthly increases including a
3.0 percent April increase. Excluding transportation, new orders increased 0.9 percent. Excluding defense, new orders decreased 1.1 percent.
Shipments of manufactured durable goods in May, down following two consecutive monthly increases, decreased $0.8 billion or 0.4 percent to $196.0 billion. This followed a 1.8 percent April increase.
Unfilled orders for manufactured durable goods in May, up four of the last five months, increased $1.4 billion or 0.2 percent to $802.8 billion. This followed a 0.4 percent April increase.
Inventories of manufactured durable goods in May, up five consecutive months, increased $2.5 billion or 0.8 percent to $304.4 billion. This followed a 0.8 percent April increase.
08:30 24Jun10 RTRS-US MAY DURABLES ORDERS -1.1 PCT (CONS. -1.4 PCT) VS APRIL +3.0 PCT (PREV +2.8 PCT) BETTER THAN EXPECTED
08:30 24Jun10 RTRS-U.S. MAY DURABLES EX-TRANSPORTATION +0.9 PCT (CONS +1.0 PCT) VS APRIL -0.8 PCT (PREV -1.1 PCT) WORSE THAN EXPECTED
08:30 24Jun10 RTRS-U.S. MAY DURABLES EX-DEFENSE -1.1 PCT (CONS. -1.5 PCT) VS APRIL +3.5 PCT (PREV +3.4 PCT) BETTER THAN EXPECTED
08:30 24Jun10 RTRS-US MAY NONDEFENSE CAP ORDERS EX-AIRCRAFT +2.1 PCT (CONS +1.2 PCT) VS APRIL -2.7 PCT (PREV -2.6 PCT) BETTER THAN EXPECTED
08:30 24Jun10 RTRS-U.S. MAY GEN. MACHINERY +5.6 PCT, ELECTRICAL EQUIPMENT -0.1 PCT, DEFENSE AIRCRAFT/PARTS -7.1 PCT
08:30 24Jun10 RTRS-U.S. MAY DURABLE GOODS ORDERS FIRST DROP IN 6 MONTHS, BIGGEST DECLINE SINCE -2.6 PCT IN AUG 2009
08:30 24Jun10 RTRS-TABLE-U.S. May durable goods orders fell 1.1 pct
After the data was released....
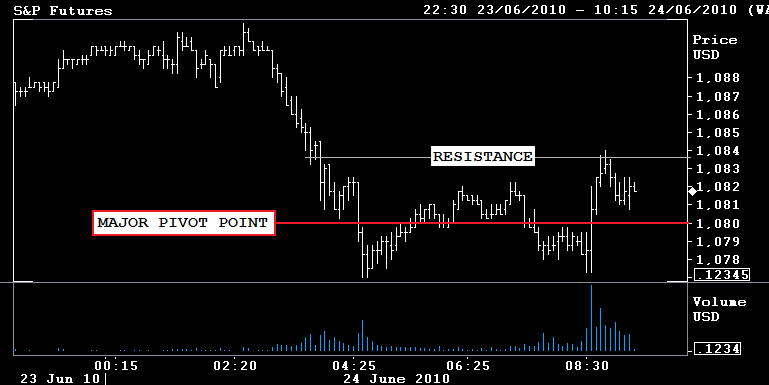
S&P futures rose but are still 5.75 points in the red at 1081.75. 1080 is a key pivot point in S&P futures. A confirmed break of this support level would lead to a test of 1070 and possibly a move back to 1050. If equity bulls (quarter end buyers) are looking for a reversal, it needs to happen between 1070 and 1080.
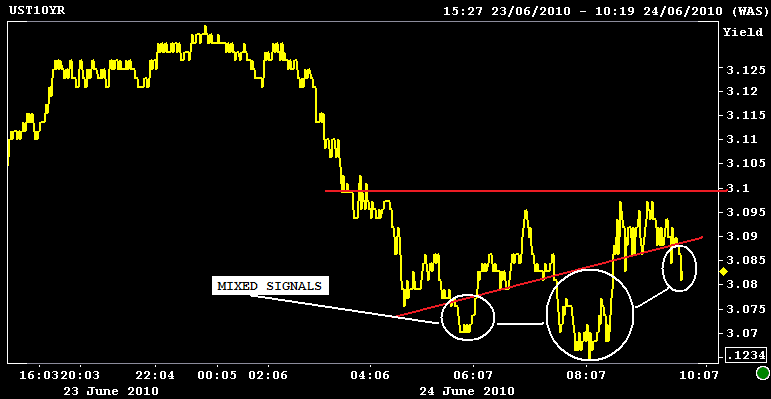
Interest rates rose across the curve. The 2 year note yield ticked up 2bps to 0.665% and the benchmark 10 year TSY note yield climbed 3bps to 3.092%.
4.0 MBS coupons traded yesterday. This means 4.25% mortgage rates were available on rate sheets. I heard of a market being made in 3.50s but that is phantom (wide bid/ask spread). For right now, because there is no liquidity in 3.5s, 4.125% mortgages are pretty much out of the question. If you look at rate sheets you should notice that there is a big drop-off between 4.25 and 4.125%. Its gonna take 10s touching and holding 2.80% before we see a liquid market for 4.125% mortgage rates.
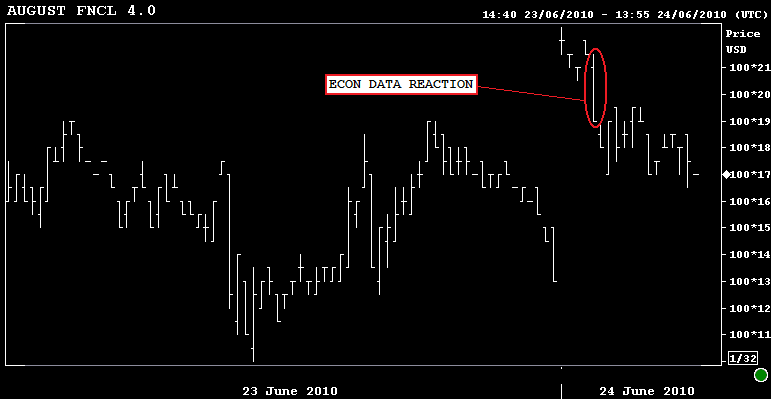
The August FNCL 4.0 is +0-04 at 100-17. The secondary market current coupon is 1.4bps lower at 3.90%. (the street looks underhedged to me. Hedge ratios too short!).
Loan pricing is ridiculously aggressive right now. 4.500% is your sweet spot on a total borrowing cost basis.


