The Treasury just sold $40 billion 2-year notes. This offering is $2 billion less than the previous auction and $4 billion below the April issue.
The bid to cover ratio, a measure of auction demand, was 3.45 bids submitted for every 1 accepted by Treasury. This is the highest BTC ratio since the October 2009 auction when 3.63 bids were submitted for every 1 accepted by Treasury. DEMAND WAS STRONG!
The high yield was 0.738%, which was well-below the 1pm "When Issued" yield and a new record low yield for a 2-year note auction. This is another sign that demand was strong.
In terms of who was doing the buying...it was not primary dealers! The street was awarded 37.3% of the competitive bid amount and only 16.6% of what they bid on. Both of these metrics are well-below average which implies primary dealers viewed this auction as expensive. That's fine though....we didn't need the dealers because direct and indirects showed up in size.
Direct bidders were awarded 21.3% of the auction and 40.6% of what they bid on. Indirects took home 41.4% of the issue and 58.5% of what they bid on. Both accounts beat out averages in terms of total auction take down but were awarded a below average amount relative to what they bid on (hit rate).
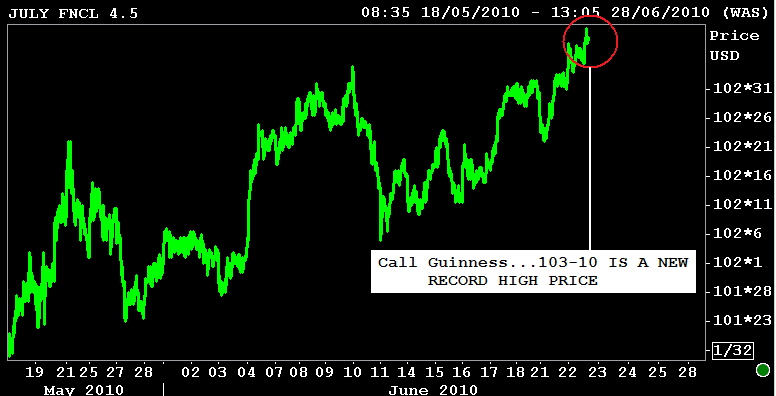
The front month FNCL 4.5 hit a new record price after the auction results were released. The July FN 4.5 is currently +0-08 at 103-08. The secondary market current coupon is -4.3bps at 3.93%. Yield spreads were tighter before the auction but benchmarks rallied afterward and now valuations are mixed with the CC yield about UNCH on the day vs. changes in the 10yr TSY note yield and slightly tighter vs. the widening 10yIRS.
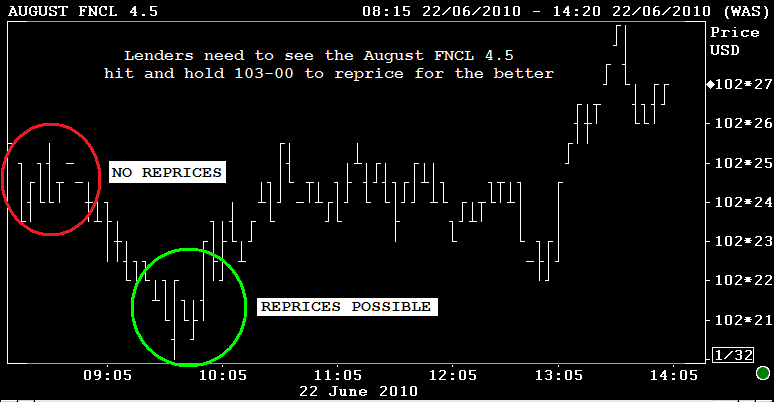
If you are hoping for reprices you should be watching the August FN 4.5 MBS coupon (and the 4.0), which is currently +0-08 at 102-27. It is possible that lenders who priced between 9 and 10am could pass along withheld margin but I wouldn't expect any love unless the FN 4.5 hits and holds at 103-00. The August FN 4.0 is currently +0-14 at 100-12. Lenders are not likely to reprice unless the FNCL 4.0 hits and holds 100-15.
The S&P has broken retracement support and 200 day moving average support. Volume is also rising into weakness so stocks may trend lower before a turnaround is seen. An S&P close below 1102 would be a bearish sign for stocks.


