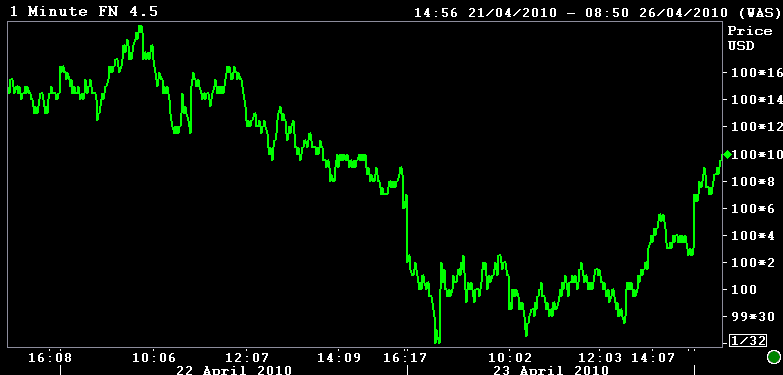
- MBS ended down 2 ticks at 100-04 on Friday. Are +0-06 at 100-10 to start the week
- 10yr notes fared worse, giving up a full 5bps of yield (0.05). Down 2.7bps at the open
- MBS spreads love to tighten into those treasury selling sessions (aka: MBS fared better than tsy's = spread tighter)
- BUT, given our recent observations of range trading in spreads, that will make MBS hesitant to gain much except in the case of major treasury rally
- So let's look at the prospects for major treasury rally.
Main focus today will be on 10yr treasury futures charts for a couple reasons. First of all, treasuries (and especially futures) lend themselves exceedingly well to technical analysis--much more so than MBS. To merely analyze MBS charts in this market (and in most any market where spreads are a moving target) makes little sense at best and could come back to bite ya at worst. So yes, this isn't the "Treasury Note Commentary," and yes, mortgage rates are indeed dictated by MBS and not treasuries, but if we're really going to do ya a solid in terms of forecasting and planning, we gotta spend some time in this section of the rabbit hole.
Anyway... Treasury Futures....
Let's take a look at where the volume occurred today:

First, let's grab a bit of context on the general movements in the rates markets by taking a look at traditional price chart to see if the movements in price and volume can offer any clues:

In case it's not exactly clear what it means to be seeing those volume spikes line up with 116-13 and not 116-16 (and don't worry if it's not! I'm not even sure it's clear to me! [send help!]), I think it will clarify things to see an actual table that breaks things down minute to minute, trade to trade. AQ pops this thing up from time to time, so you may already be familiar. If not, just know that the tables below show a couple important things:
- the TIME of the trade,
- DIRECTION of Trade: whether it was an offer getting "lifted" [meaning a buyer chose to "lift" a sellers offer off the table, thus raising (or even lifting?) the price], or a bid getting "hit" (meaning a seller chose to hit the buyer's bid, thus lowering [or "hitting" the price?)]
- VOLUME of trade
Knowing those things tells us A LOT about what's going on. And if you're super savvy, you may have already deduced that the big volume was indeed big selling as BIDS around 116-16 got HIT (big time) and thus "hit" the price down to about 116-13... But let's see it in it's bare-bones, linear format, shall we?

No two ways about that one! Sellers were already in with average volume leading up to the 830 data release (730 chart time since this is CME data, which goes off local chicago time! so 730 above = 830 NYC time), then BOOM, BANG, 13k contracts and 18.5k contracts back to back... HUGE... Both bids getting hit... (note the red downward arrows). At this point, some big players had spoken. They were saying "we're cutting our losses at this 116-16 level after waiting for this AM's data, as we think things go south from here."
Granted, that could have been overcome if offers started getting lifted, for whatever reason, but as you can see with the concentration "red arrows" in the table above, sellers dominated. The only other data release of the day was an hour and a half later at 10am NYC time, so let's look at 9am chart time:

Ka Pow! Completely DEAD leading up to 10am, then huge hits on bids right around that same 116-16, tanking the price again. In the 20 minutes that followed the release 16 out of 19 trades was a sell. Buyers did a fair to middlin' job of clawing things back, but not with conviction. Last time we saw this much action around this price level was mid month when prices were aimlessly searching for guidance and "coiling" around the 116-16 mark.
AQ talks about "releasing stored energy" and that's exactly what happened. After a brief head fake to the downside caught some support from the dotted yellow uptrend, prices briefly returned to the coiling patten, then "broke north with no delay" (name the band!) That was "buyers lifting offers" as opposed to what we've seen today as "sellers hitting bids." Considering the breakout of that dotted yellow line you see in the chart below, we're thankful to at least caught some sort of bid potential from this previous "indecision zone" around 116-16.

OUR VERY BEST AND HIGHEST HOPE is that things could manage to hold on here and then maybe get lucky with some bond-bullish auctions. But the predisposition in the markets at the moment is skewed a bit bearishly, and it looks like a correction within the longer term ranges may be upon us next week. Given the challenges posed by spreads in MBS, it's hard to be optimistic about floating too many deals.
Though that's not to say floating might not pay off, It's just that given the potential gains vs. the potential losses, combined with the factors influencing both, things at the very least, don't balance out.
So how exactly do MBS and treasuries look? Here's the short term chart. We see the breakout of the uptrend, but catching potential support from horizontal levels...

Let's zoom out on these one time to see some of those in the bigger picture:

The only question that remains for this week is "what's on the other side of that door?" A love shack? Or that which we more readily associate with B-52's... (hint: big 'ol bomb getting dropped on bond market).
The potentially reassuring thing is that the hugely explosive bombs probably wouldn't find their way onto our rate sheets unless the auctions tank. There IS a chance that we can kind of muddle through until auctions and HOPE for great results to buoy prices, maybe even back into previous trend ranges. BUT, if that doesn't happen, we could be pushing back up for a re-test of 3.92 in 10's, give or take (and to be refined if needed as we may or may not approach).
The FN 4.5 is +0-06 at 100-10 yielding 4.461%. The secondary market current coupon is 4.461%. The CC yield is +67.7 basis points over the 10yr TSY note yield and +67.4 basispooints above the 10 year interest rate swap.
REPRICES FOR THE BETTER WILL BE BAKED IN INTO INITIAL RATE SHEETS
REPRICES FOR THE WORSE AROUND 100-01


