Happy Hump Day
Recap of Yesterday
- October Producer Price Index +0.3%. Core Prices -0.6%---much weaker than expected. Strength: Energy +1.6%, Food +1.6%. Crude goods +5.4%. Weakness: +0.3. Cars -0.5%, light trucks -5.2%, computers -0.3%. Rising commodity prices to blame for higher raw material costs.
- September TIC Data: strong foreign buying of US Treasuries +$44.7 billion in September. That is huge increase. MBS and Agency debt -$1.8 billion. That is small decrease. Overall a good read on demand for US debt, Treasuries clearly preferred over MBS. China was the biggest supporter of TSYs...taking in over $15 billion.
- Oct Industrial Production: +0.1% vs. +0.6% in Sept. Worse than +0.4% consensus. Autos -1.7% vs. +8.1% in Sept
- Oct Capacity Utilization at 70.7, highest since January.
- NAHB expects activity to pick up in 2010. Concerned about valuations. READ MORE
- Voice of Housing: Make the FHA an Independent Agency. READ MORE
- FN 4.0 ends the day at 99-13 yielding 4.066%. FN 4.5 goes out at 101-25 yielding 4.282%. Secondary market current coupon at 4.12%. CC +79/yr TSY. CC +70/10yr swap.
- MBS sellers dominate market. Originators, Money Managers, Hedge Funds, Asia all selling. Servicers buy in morning, help keep spreads from gapping out too much, however later in the afternoon, more originator selling then pushed yield spreads wider into the close. Fed not as active as usual. Much need spread widening.
- Yield curve flatter. 10yr trading in range. Firm support at 3.37%. Firm resistance at 3.32%.
So Far this Morning
- SHANGHAI +0.62%, HANG SENG -0.32%, TOPIX -0.81%, NIKKEI -0.55%, CAC +0.61%, DAX +0.75%, FTSE +0.33%
- Housing Starts: -10.6% vs sept +1.9% (prev +0.5%). 529,000 unit rate (consensus 600,000) vs sept 592,000 (prev 590,000)
- Housing Permits: -4.0 pct vs sept -0.9 pct (prev -0.9 pct). Permits 552,000 unit rate (consensus 580,000) vs sept 575,000 (prev 575,000)
- Housing Completions: +1.9% to 740,000 unit rate vs sept 726,000. Lowest rate since april 2009, percent drop biggest since jan 2009
- Starts for five units or more at record low 48,000 unit rate. Homes under construction at record low 560,000 unit rate
- CPI +0.3 % (+0.2753; consensus +0.2), exfood/energy +0.2 % (+0.1818; cons +0.1 %)
- CPI year-over-year -0.2 % (cons -0.3 %), exfood/energy +1.7 % (cons +1.6 %) unadjusted cpi index 216.177 (cons 216.04) vs sept 215.969
- Energy +1.5 %, gasoline +1.6 %, new vehicles +1.6 %, food +0.1 %, housing +0.1 %, owners' equivalent rent unch
- Core CPI seasonally adjusted index 220.453 vs sept 220.053
- Real earnings -0.1 % (cons -0.2) vs sept -0.4 % (prev -0.4%)
- New vehicles prices rise largest since may 1981 (+2.2%)
The rates market is currently dealing with quite the confluence of technical, seasonal, and fundamental influences. After spending two weeks focused on a steepener bias, yield curve traders unwound those positions on Friday and Monday. However, as many traders had already sold short calls (you sell a short call if you think rates prices are going to fall), and the market was heading in the opposite direction, those positions were forced to cover, which added some momentum to the rates rally (much of the crowd was short at a 119-00 strike price and above).
Plain and Simple: buying in the long end of the yield curve snowballed as prices rallied in the opposite direction of short positions.
Again, as discussed yesterday, with month-end index extensions around the corner and year-end not far off in the distance...balance sheets are already being assessed for window dressing. This means an added demand for AAA rated assets and gladly accepted seasonal support for the rates market. On top of the usual month-end/year end support offered to our market, the current state of economic affairs in the US is beginning to grab the attention of more and more skeptics. The notion of a double-dip is clearly on the radar of risk averse market participants.
Adding support to that outlook was yesterday's TIC data, which revealed demand for US debt remains strong (see above bullet points). That said we must continue to pay respect to the fact that the global marketplace remains "on edge" and defensive of asset valuations. While we are well-aware of the above discussed seasonal effects and continually evolving BIG PICTURE biases, we are still not willing to place a spotlight on them in terms of short run directionality. What moves money on a day to day basis, and therefore affects mortgage rates on a day to day basis, is more a function of short term trade tactics and strategy. Yes the data matters, but only in a manner that moves rates within the range, or from range to range...data remains a catalyst for directionality, an excuse to book short term profits. (But we are still keeping a close watch on data trends, just not in a way that would imply a trend in the market (trend trading vs. range trading)
Plain and Simple: we respect the BIG PICTURE but know the #1 goal of rates traders is to churn profits
This point is again obvious this morning. The above discussed "short covering" has built a firm base of support under the market at 3.37%. While the morning data served to bring out a bit of chopatility, 3.32% is still strong resistance and 3.37% is still strong support. Again...the data was an excuse to churn profits within the three day range. The question is...will upcoming data be weak enough to push 10s through 3.32%?

As would be expected, the price volatility exhibited by our directional guidance giver (benchmark rates) has spread into the mortgage market. It's been a choppy morning so far in terms of MBS prices. Unfortunately, the ups and downs are occurring in the RED for "rate sheet influential" MBS coupons.
The FN 4.0 is currently -0-07 at 99-07 and the FN 4.5 is trading -0-05 at 101-20.

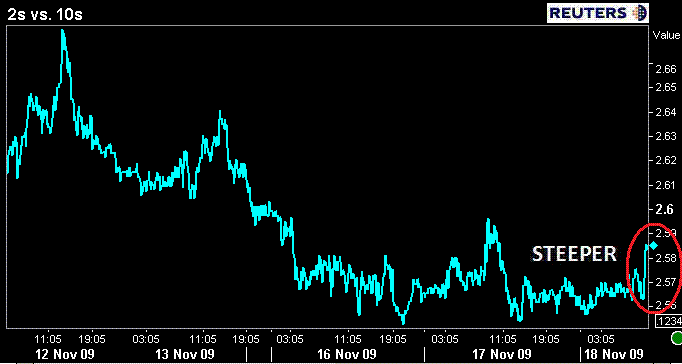
The yield curve is steeper and rates are higher so far this morning...the range should continue to contain losses.
Lock bias still on...


