Hello and Good Morning to all...
Today is the final day to close September loans, the last day to dress up Q3 balance sheets, and the end of the government fiscal year...ITS A MAD RUSH TO BUY STUFF!!! (although I hear government is spending less this year...HAHAHAHAAHA LMAO)
The recent bond market rally has led the yield curve and benchmark TSYs into numerous resistance levels that, if broken, might imply a general shift in the sentiment of the market place. Although the convergence of month end and quarter end supportive events have likely led us to consider a potential range break and new trend trading environment, we cant ignore the yield levels fixed income investors have accepted all week. Or can we?
Is the recent rally in TSYs and MBS a function of month end/quarter end supportive events? OR Is there a paradigm shift occurring in the marketplace?
OF COURSE...because our main analytical focus is centered around housing and the mortgage industry, we are more apt to believe that the perception of a recovery has been brought about by government stimulus and buy side momentum/profit churning in equities.
Although month end index extensions and quarter end window dressing have helped the yield curve flatten (bull flattener) and rate sheet influential MBS coupons move to four month highs...there are several sobering truths that all must eventually come to grips with....
Credit remains tight, housing inventory (plus shadow inventory) is still uncomfortably high, jobs are not being created, and the government is spending at a record pace to support the entire system. GAME OFF---No we are not concerned about core inflation skyrocketing---GAME ON. Making matter worse...housing data has shown signs of improvement...giving the media and politicians an opportunity to focus on seemingly more important issues like health care. Housing and mortgage professionals know this is a major mistake...but we will address later.
Unfortunately the market does as it pleases (see relentless stock rally), and while we believe a correction/double dip/maybe just long term anemic growh is unavoidable, we cannot offer definitive answers to the questions posed above regarding the overall bias in the market and the direction rates will head in the future....we can however explore the roadblocks we must break through before declaring mortgage rate victory!
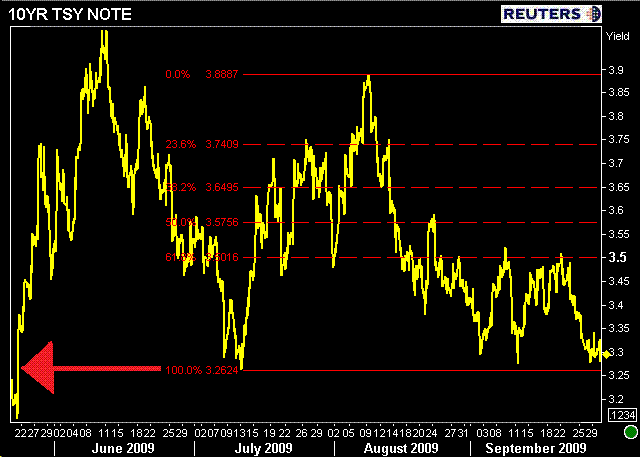
First..there is THE RANGE. The 10yr hasnt broken 3.27% all summer. We've been testing this yield level all week..and failing repeatedly. If mortgage rates are to fall further, we at least need a breakout in the long end of the curve (although lenders will not likely pass along all the gains).
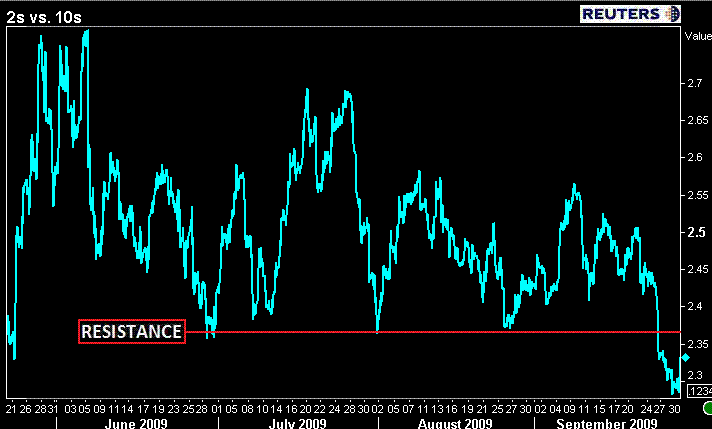
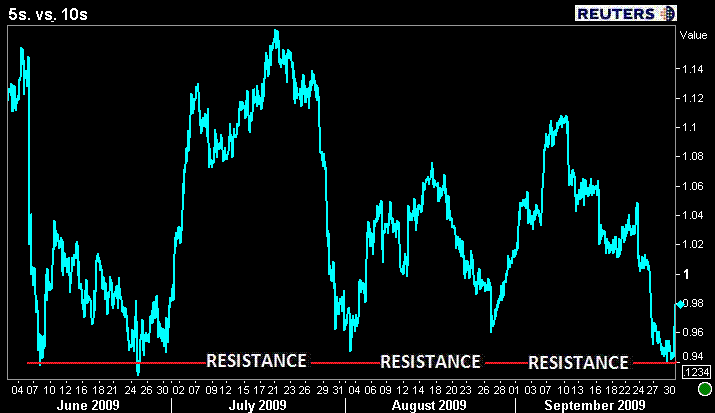
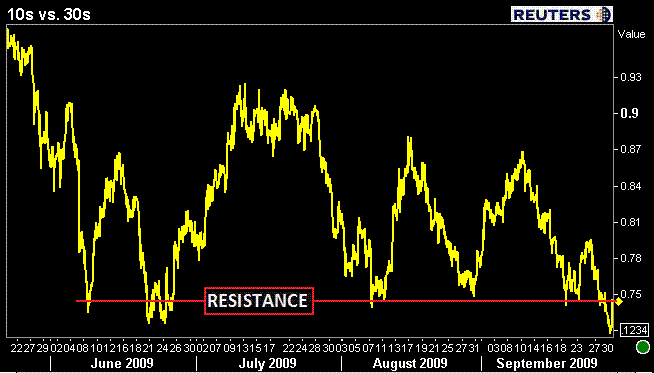
Then there is the CURVE RANGE...2s/10s, 5s/10s, 10s/30s, FLATTER vs. STEEPER. These yield curve spreads tell us when one part of the curve is too cheap or too rich vs. another part of the curve...they inform us whether to buy 10s and sell 2s or to sell 10s and buy 2s. There are a few yield curve spread RANGES that are testing long term resistance levels.
After failing to break 236bps all summer, 2s vs. 10s moved below 230bps this week....
5s/10s are testing summer long resistance at 93bps...
10s/30s are testing summer long range resistance at 75bps...
In order for the proposed CURVE SPREAD TRADE BREAKOUT to occur...2yr yields would need to rise faster than 10 yr yields OR 10yr yields would need to fall faster than 2 yr yields. The first option would only occur if the Fed started to openly discuss/alert the market that they were considering a rate hike...otherwise 2yr yields will stay low because of record low Fed Funds rates. If that did occur..it would be BAD FOR MORTGAGES because benchmark yields would be rising. That leaves the latter option as the best bet...a BULL FLATTENER. 10yr yields would have to fall faster than 2 yr yields. This means the 10yr note needs to break its summer long 3.27% resistance.
Then another dilemma arises...if traders buy 10s over 2s and the curve flattens...2s would look cheap vs. 5s and 10s would look expensive vs. 5s. Then traders would start buying 2s over 5s, but then 5s would look cheap vs. 10s and traders would sell 10s to buy 5s ...and the curve steepens and we start all over again. This isnt exactly how the TUT, FYT, FOB, NOB, TYT, TOF trade plays out...but I think it accomplishes what we needed....
Our point: First...we wanted to show you how absolute yield levels are not the only thing that matter when it comes to the issue: ARE RATES GOING HIGHER OR LOWER. Remember: the steepness or flatness of the yield curve creates spread trading opportunities which consequently affect the absolute yield levels you have become so accustomed to monitoring.
Second....if mortgage rates are to have the opportunity to move lower...the yield curve will likely need to undergo a BULL FLATTENER. The other option is the Fed could REITERATE LOW RATES POLICY FOR AN EXTENDED TIME and a FTQ would drag down yields in general. Either way...10yr yields need to fall. SEVERAL LEVELS OF CURVE SPREAD AND ABSOLUTE YIELD LEVEL RESISTANCE must be cleared.
PLAIN AND SIMPLE: Even if yields go lower in the long end, namely the 10yr yield dropping below 3.27, it may only be temporary unless the YIELD CURVE AS A WHOLE supports relative yield levels. In other words, yields in the shorter end of the curve would also need to drop a nominal amount in order to MAINTAIN ENOUGH BALANCE BETWEEN various points on the curve. BOTTOM LINE: we need BOTH "absolute yield" AND "relative value" (10's can't get too expensive versus 2's, etc...) to play ball if MBS are to meaningfully improve.
Anyway I have already rambled along enough for one blog post. Share your thoughts please. We will continue the discussion later.
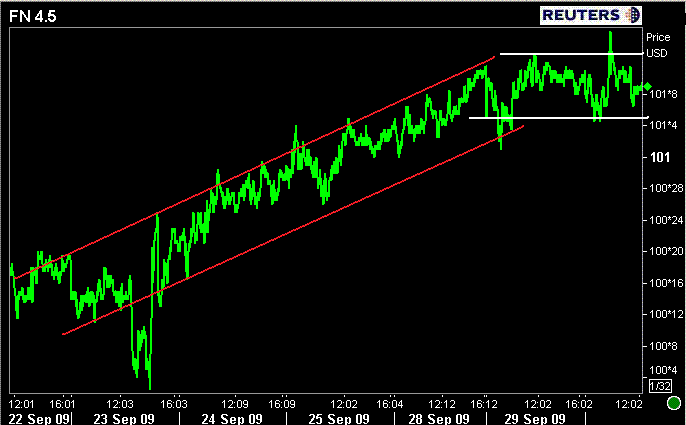
The FN 4.5 is currently trading -0-02 at 101-10 yielding 4.3391%. The FN 4.0 is trading -0-01 at 99-02 yielding 4.1176%. The secondary market current coupon is 4.2173%.
Here is a longer term look at the FN 4.5 trend channel...
Rate sheet rebate was trimmed this morning. Mortgage rates are slightly higher today.


