Despite better than expected econ data (plus Bernanke's comments which fueled the following), rallying stocks, a weaker dollar, more expensive oil, and gold moving back into four digit $$$ territory...the bond market managed to avoid an all out FACEMELTING sell off today. (Caveat: most of today's bond weakness was priced in yesterday)
Mostly because we dont want you to start over thinking the market's ups and downs....we feel the need to hammer the concept of RANGE TRADING into your heads.
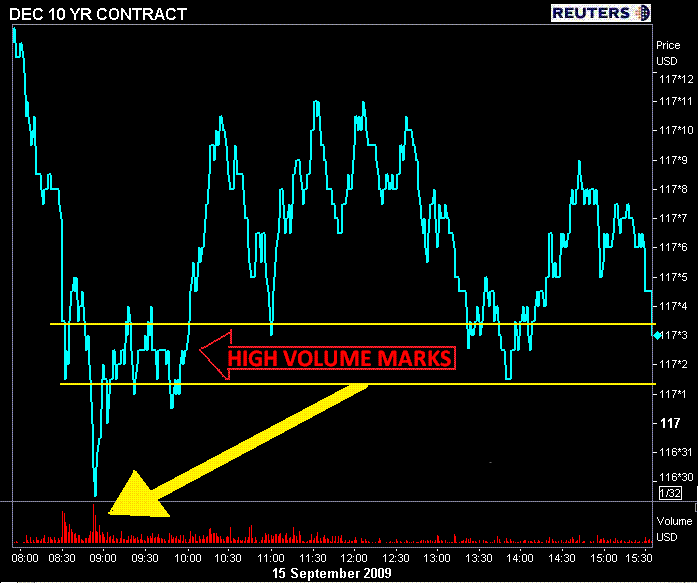
This morning we discussed a possible floor in 10 yr TSY futures prices around 117-04. This was the price point at which many positions were established after 830AM data. I illustrated this in the chart below. Notice the accumulation of volume at 830AM (hint: look at the big yellow arrow haha). Now look for intraday support....dont look to hard, its within a few ticks of 117-04 (between the yellow lines).

After all that intraday price volatility (putting up a good fight), trader's eventually found their way back to where their day began...but not after day trading profits could be taken. BUY LOW-SELL HIGH should be a bit more obvious when examining the above chart.
The point: DAY TRADING is a major part of intraday price action! Dont get sucked into over analyzing the headlines...its about making a profit. Dont forget what boosted bank earnings....Fixed Income, Currency, and Commodity trading!!! CHURN THE MARKET, TAKE PROFITS, then CHURN IT AGAIN, then TAKE PROFITS...TRADE THE RANGE TO YOUR ADVANTAGE.
This all occured in what we would consider average volume (for summer not for fall). 750,000 10s were traded. 133K 2s, 365 5s, and 170K 30s.
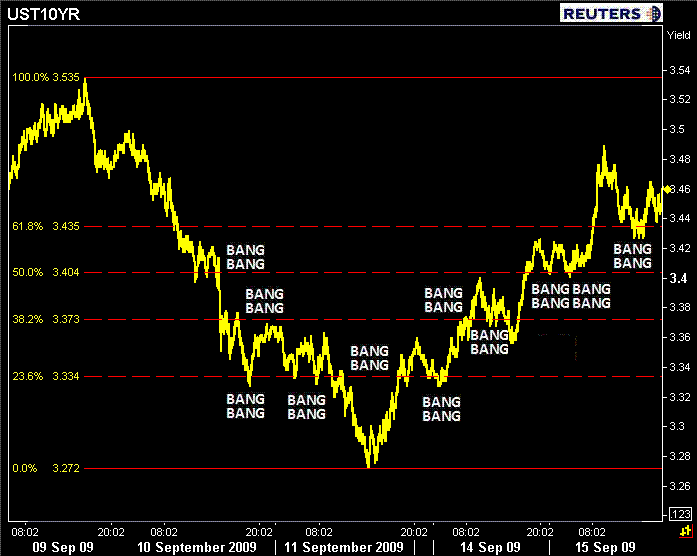
Switching from futures to the cash market....the 10 yr TSY note fell -7/32 to a price of 101-15 today.... yielding 3.445%. AnYway here is a chart that further illustrates the methodical "range boundness" of trade positions...each tick higher mirrors last week's moves lower (in yield)...its been a steady retracement.

BTW...I didnt include this on the chart but the 20 day moving average is 3.448%. COINCIDENCE? No.
Now, what youve been waiting for.... the MBS market!!!! (Family Feud music playing in background)
HAHA I dont know why I chose FAMILY FEUD...probably because its awesome.
Actually, MG will discuss specific MBS market trade flows, I am only going give you a chart and quick price update.
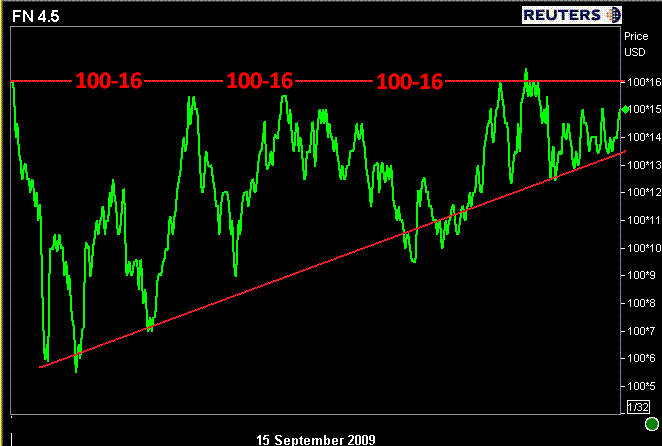
The FN 4.5 is currently trading -0-01 at 100-15 yielding 4.445% at 5 CPR. (That means the spread between the FN 4.5 and the UST10YR is 100bps...tighter vs. the OPEN. And we think 5 CPR is still fair). 100-16 served as strong overhead resistance...

Here is a hint as to what MG will discuss: SEE THE TITLE OF THIS POST!
2s/5s BARELY steeper at 146bps
2s/10s SLIGHTLY steeper at 251bps
5s/10s unchanged at 106bps
10s/30s unchanged at 81bps
RATE SHEETS MOVED HIGHER THIS MORNING AND HAVENT CHANGED HEADING INTO "GOING OUT" MARKS...
In other news...
- The Fed bought $2bn in TSY debt maturing in the Feb 2021- 2026 sector vs. $7bn submitted. No surprises here...
- Barclays says they expect the S&P/Case-Shiller Home Price Index to bottom earlier than anticipated...at the end of 1Q 2010. Peak to trough forecasted at 36%. Previous forecast called for 3Q 2010 bottom and 40% peak to trough
- Answering questions after giving an "already read" speech...Bernanke says "Even though from a technical perspective the recession is very likely over at this point, it's still going to feel like a very weak economy for some time"
- $17bn in corporate issuance today...hedge unwinds were helpful!
- Three month LIBOR at record lows. OIS at 13bps....narrowest since Q3 2007. Tighter spread = massive amount of liquidity in banking system
- OPEC leaves world oil demand forecast unchanged at average of 28.06 million bpd
Regardless of the bond market's resiliency today...technicals are pointing to continued weakness/choppy sideways trading at best. The range is becoming a trend...
:-(


