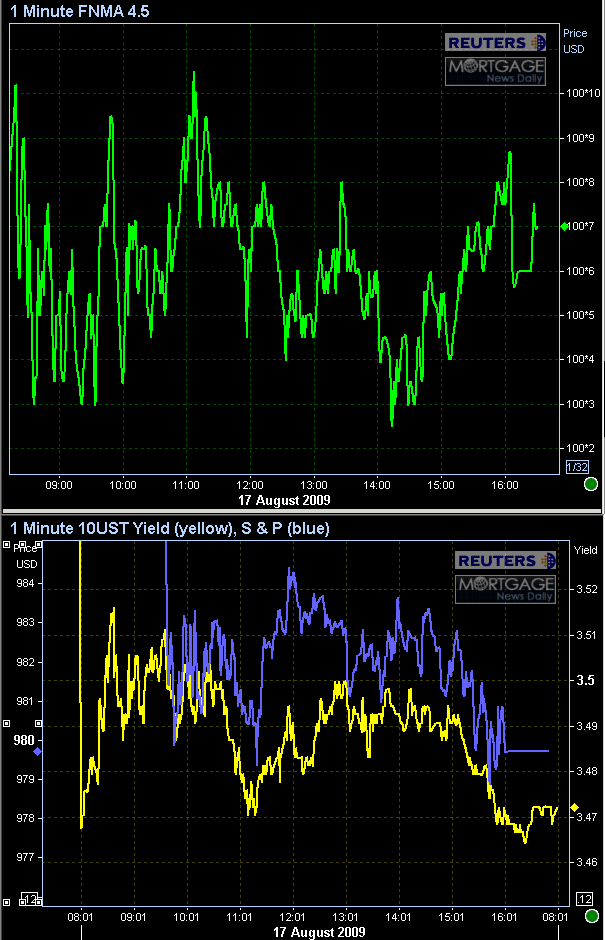
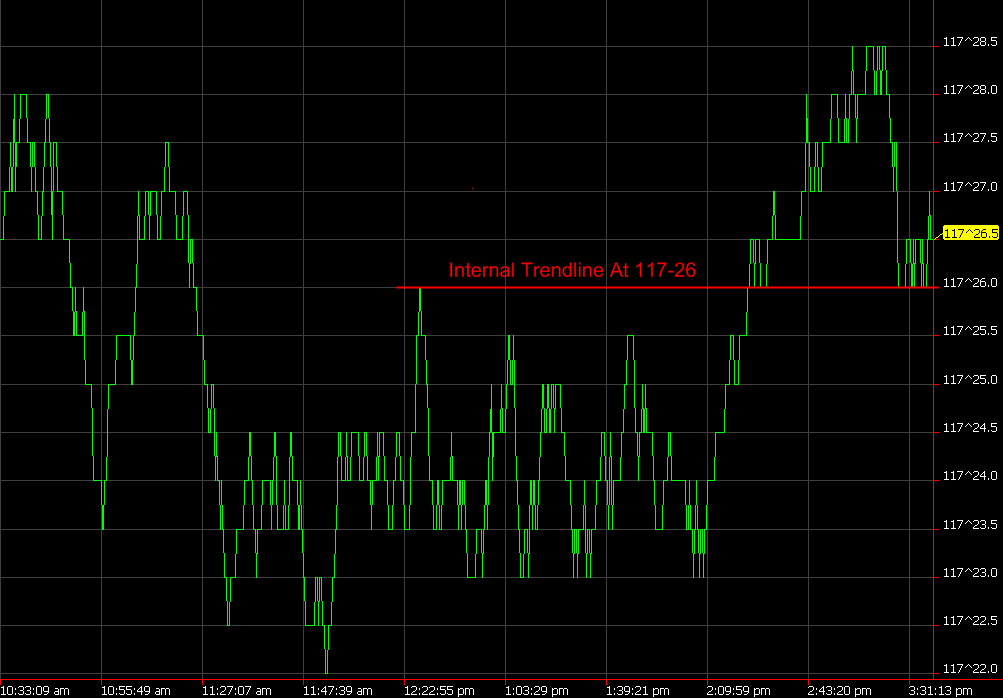
As can be seen on the chart, MBS prices faded to black today just a tick under the 100-08 price from our aftertoon commentary. Even if they'd been a bit farther off than that, the final hours of trading are rarely as significant as the majority of the day. In addition, optimism was afforded by the strong technical bounce in 10yr futures at the end of the day. MBS are perhaps one of the least conducive securities for technical analysis. 10yr tsy's are much better, but tsy futures are better still. After attempting to twist, poke, and prod MBS into behavior on certain technical studies, working similar analytics on futures is always a joy. For instance, notice on the chart below the major outlying upswing in the middle of the day in futures. Once that was broken near the end of the day it held up to a few decreasing price attacks. This earns it a short term designation as an "internal trendline" and the repeated stability in the late hours of the day adds further to the sideways sentiment as we gear up for tomorrow:
Markets may be eager to latch on to any positive data releases in the morning even if they are relatively unimportant. The PPI is actually one of the better reports that could come tomorrow since further evidence of diminishing inflation (all but off the radar anyway) has, in the past, been beneficial for both stocks and bonds. This is in contrast to other types of data that normally cause inverse movement in the two sectors. As far as housing starts, numbers would have to surprise fairly strong to the upside to damage bonds as we're already on our third month of ever-so-modest gains. Another gain would just add to a trend that is already baked in to stocks. A surprise retracement, however, could add yet more fuel to today's flight-to-quality fire. Again, it would have to deviate by quite a bit to cause discernable movement as the report in and of itself is not a top tier market motivator.
We'll leave it with a multi-colored Rorschach for you to digest. Here's a day over day futures chart:
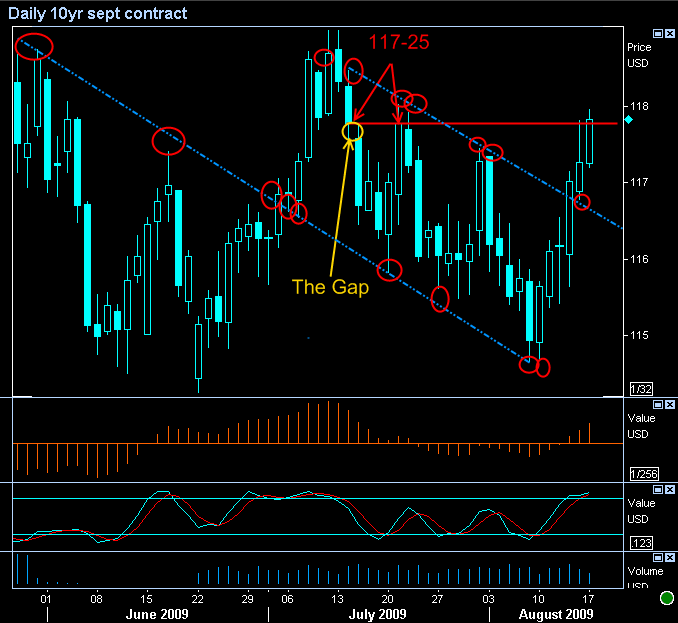
Here's what I saw at first glance... Use the comments section to let us know what YOU see...
- - Lower blue line forms internal downtrend line from junes highs to july's lows. Solid bounce off that line 2 days in a row in early August (all the red circles)
- - Upper blue line runs parallel to that internal trendline, and has provided overhead resistance for about a month
- - Upper line was broken on Thursday, tested on Friday, and confirmed today.
- - Not only did today's action confirm that breakout, but we also entered into a test of the 117-25 price level which is significant because of the gap highlighted in yellow. Prices "gapped" down after closing at 117-25 and have not seen that level since. They were tested the day after in intraday trading and failed. They were also tested 4 days later with closing prices and failed. Friday was the first test since then. It too failed in intraday trading. Today, however, finally broke through both in intraday trading and with a closing price 1.5 ticks higher at 117-26.5.
- The MAJOR caveat to all this is volume. I'd be VERY hesitant about considering this a confirmation of a breakout until we are on top of this price level either by a much larger margin than a tick and a half or until we are above it with significant volume.
- As it stands, the previous post mentions the only significant volume today voted for a "leveling off" in MBS around 100-08. That usually means ceiling time! But if we've had any chances to "find the love" in recent months, the current environment might be shaping up to play ball.


