
Mortgage rates shot higher this week. The new "best execution" par 30 year fixed mortgage rate has jumped firmly up to 4.75%.
We have offered several different explanations for rapidly rising rates. In the end it comes down to a confluence of factors that have been greatly exaggerated by apathetic investor attitudes as we head into year-end on Wall Street (we explained in THIS POST).
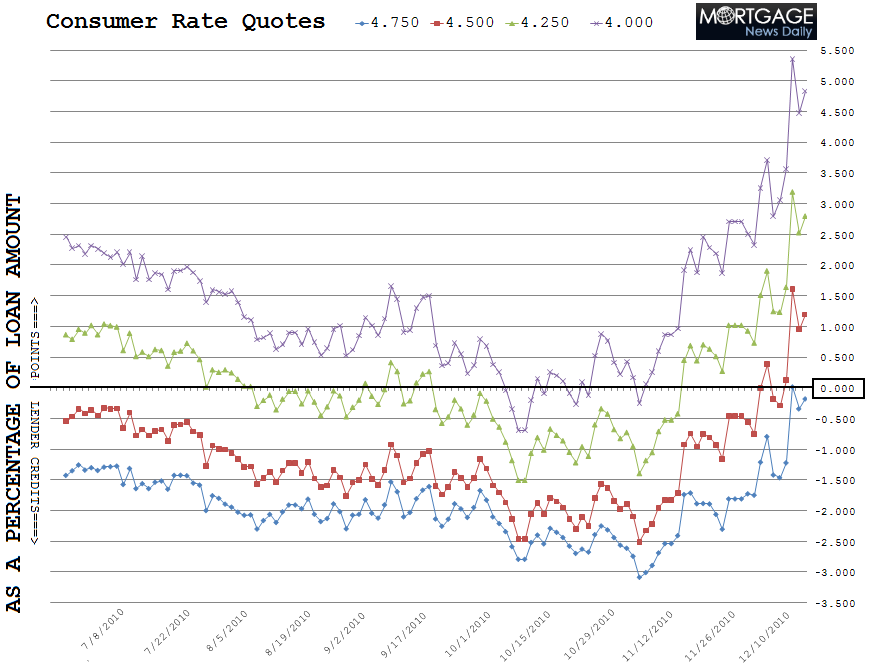
To illustrate the speed and scope of this spike I have created a mortgage rate chart using my loan pricing model. On this graph you will see four different colored lines. Each line represents a different 30 year fixed mortgage note rate. The numbers on the right vertical axis represent origination closing costs as a percentage of your loan amount. Also notice the dark black horizontal line at 0.00. If the note rate graph is below the 0.00% marker, then the consumer should be expecting closing cost help from their lender in the form of a lender credit toward third party fees. If the note rate line is above the 0.00% marker, the consumer should expect to pay additional points at the closing table to cover permanent buydown fees. These cost estimates were generated using average loan pricing quotes from the five major mortgage lenders.
As an example, 4.00% note rates would cost a borrower almost 5 discount/origination points at the closing table, as a percentage of their loan amount. This is clearly not advisable nor is it attainable. A more relevant example is the 4.75% note rate. A very well-qualified consumer should be able to close on a 30 year fixed mortgage at 4.75% with no additional originator compensation related closing costs. 4.75% is basically at the 0.00% line though, so on average most consumers should not be expecting much closing cost assistance (third party fees) at 4.75%.
Plain and Simple: if the note rate line is moving up, the closing costs associated with that quote are rising. Thus, it should be obvious how mortgage rates have behaved over the past month. They've moved significantly higher. And fast....
Important Mortgage Rate Disclaimer: Loan originators will only be able to offer these rates on agency conforming loan amounts to borrowers who are have a middle FICO score over 740 and enough equity in their home to qualify for a refinance or a large enough savings to cover their down payment and closing costs. If the terms of your loan trigger any risk-based loan level pricing adjustments (LLPAs), your rate quote will be higher. If you do not fall into the "perfect borrower" category, make sure you ask your loan originator for an explanation of the characteristics that make your loan more expensive. "No point" loan doesn't mean "no cost" loan. The best 30 year fixed conventional/FHA/VA mortgage rates still include closing costs such as: third party fees + title charges + transfer and recordation + escrows (things like upfront MIP (if required), property taxes, homeowners insurance, accrued interest)".
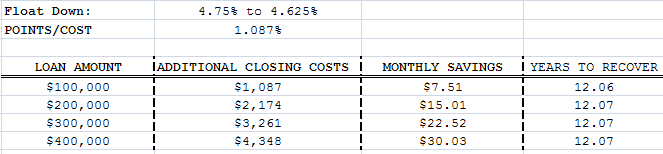
I provided the breakeven analysis below on Wednesday. While the breakeven on a 4.625% permanent buydown is slightly cheaper today, these numbers are still very relevant....
I say 4.75% is "Best Execution" because there is a large gap in loan pricing between 4.75% and 4.625%. Meaning the buydown structure for loan pricing below 4.75% is very unattractive for borrowers looking to float down their mortgage rate to 4.625%. Of the major lenders, the average cost to buy your note rate down from 4.75% to 4.625% is 1.087% of your loan amount (due at closing).
Below is a breakdown of the borrower's cost to float their 30 year fixed mortgage rate lower from 4.75% to 4.625%. I would only advise executing this float down if you are sure that you will still be paying on this same mortgage in 12.07 years. Otherwise it is not worth the increase in upfront closing costs.
Plain and Simple: There is a clear line of demarcation between 4.625% and 4.75%. If you are looking to close in the next 2 weeks...4.75% is your likely target. Very-well qualified borrowers should shoot for no points.


