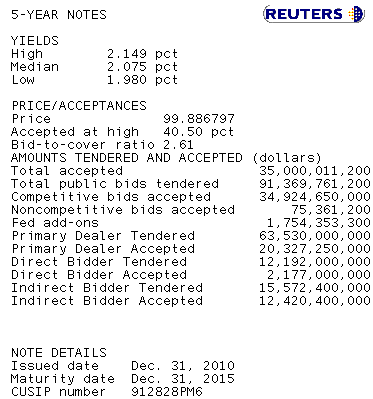
With a bid-to-cover ratio of 2.61, the 5 year note auction was weaker than recent averages. The high yield of 2.149% was also noticeably higher (4.4bps) than the 1pm "When Issued" yield. Dealers were awarded 58.2% of the issue vs. their 45% average. Directs added 6.2% vs. their 12% average. Indirects took home 35.6% vs. their 44% average. This auction was sloppy all around. Dealers were forced to do most of the heavy lifting, which is evident by the 4.4 bps tail vs. the 1pm "When Issued" yield.

It's been a low-volume sell-a-thon ever since, meaning REPRICES FOR THE WORSE are coming if you have not seen them already.
To qualify "low volume," it should be noted that relative to today and yesterday, volume merely spiked into this sell off, as shown in the futures chart below.

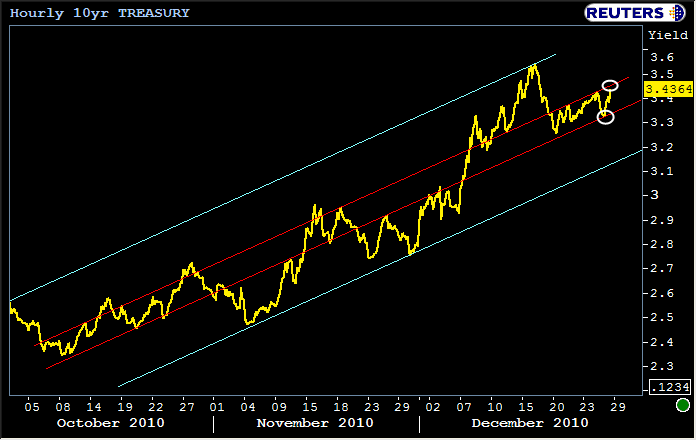
For more "perspective" on what looks like a pretty ugly red candlestick in the above chart, here's how the 10yr note has been affected in the context of yesterday's mid-term trend channel.
It has essentially moved from 38% to 62% of the prevailing range. (remember that 38 and 62 are common stopping points in an overall range from 00-100%). This is the chart you need to come back to if you're like many folks right now who are scratching their heads trying to make sense of the apparent over-reaction. We had a weaker than expected auction or a more-central-to-the-curve security, following a rally yesterday, all amidst very low volume. It's quite logical that we'd see rates backing up exactly as much as they are.

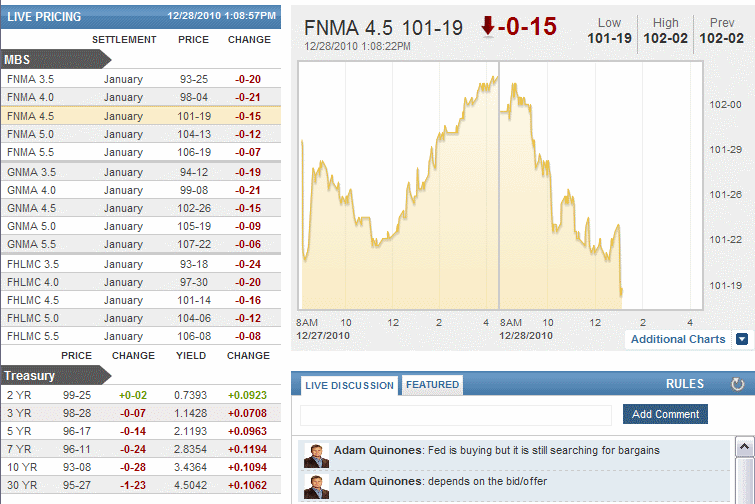
But perspective aside, the MBS stack and the yield curve alike have been battered. Prices are at their lows of the day, yields well above previous highs. Reprices for the worse could get heavy-handed...


