Let us have no illusions about the market on this holiday-shortened week. As expected, trading conditions are becoming progressively thinner and volume progressively lower. The Fed is done buying for the week, and next week brings the task of taking down another round of 2, 5, and 7 year auctions. Given that low level of participation, it does not strain credulity to think that rates are under a bit of pressure to to back up into an ideal tactical position from which to strike at next week's auctions. Or maybe instead of saying "under a bit of pressure to back up" we should say "not getting much support from sidelined buyers". Real$ bid wanted.
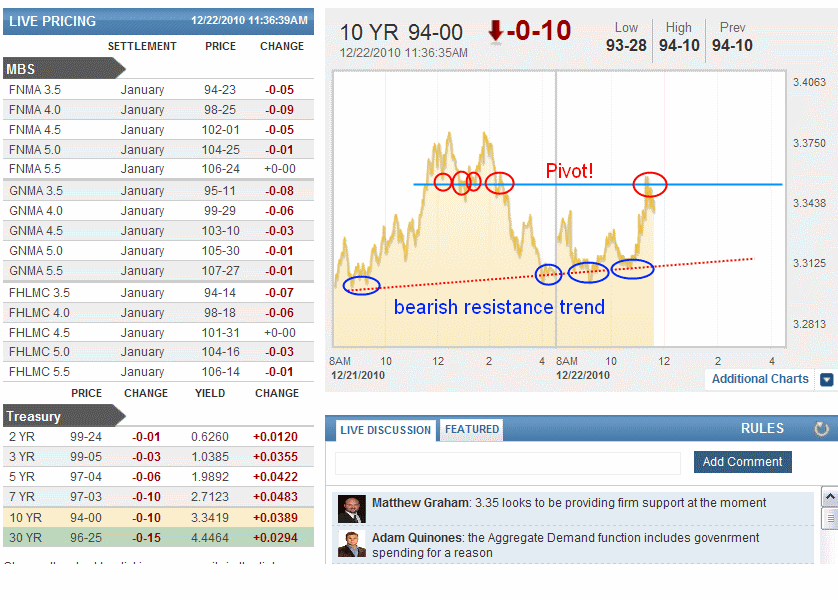
It's really that simple. There's not much driving the markets, and whatever movements we do see are not representative enough of broader biases for us to make much of a stink about it. Technical undercurrents remain, and indeed have been adhered-to fairly well in the past few days. But rather than speak to any impending shift in sentiment, they do more to simply SHOW what the trends are, as opposed to suggesting what the trends may do next. Competing trends are shown in both the MBS and Treasury charts below.

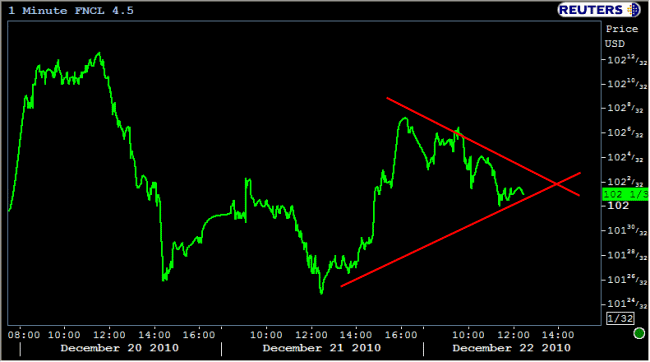
To add a more complete picture of production MBS coupons, here's how the FNCL 4.5 is faring. Notice the triangle pattern and consolidation of recent gains.

Bearish trends are certainly more established at the moment, which is to be expected if we're right about the market beginning to build in a concession for next week. However, 3.37 to 3.35 in the chart above is perhaps equally as firm, or rather, it would be if we could ascribe such definitions to a market with this volume. Not including liquidity asterisks, recent behavior would suggest we should still be expecting a range trade between 3.27 and the cluster of support around 3.36%. But we know better than to make any assumptions at this time of year and to focus largely on technical considertions. Chart patterns say "TRIANGLES FORMING. ENERGY IS STORING. WATCH FOR A BREAKOUT ON EITHER SIDE."


