Last week, we noted that lenders were not likely to add production into year end. In addition we talked at length about the "big difference" between 4.75 and 4.625.
"...we'd set our 'best ex' loan pricing targets as follows: 4.75% is your base. You don't want to lose 4.75% This is your line of demarcation. Anything attractive below 4.75% should be considered sacred. Especially float down friendly 4.50% par pricing. A close examination of loan pricing shows that we are indeed being "nudged" toward loan rates that can be pooled in 4.5 coupon MBS. Lenders are effectively doing this by gradually shifting better execution to those rates that correspond with 4.5 coupons as opposed to their next lowest neighbor on the rate sheet. 4.75 vs. 4.625 is a good example of this as we can see float-down there getting more expensive day over day."
This continues to be the case today as not only 4.75% is still on the "ledge" in terms of buydowns, but we have also seen wider primary/secondary loan pricing spreads (MBS indications vs. rate sheet rebate). This means loan pricing is a bit worse than MBS prices would suggest. Though this tends to be the case into MBS rallies, we see the phenomenon as exaggerated at the moment by lenders who are apathetic toward adding new production into year-end.
Granted, primary/secondary spreads could tighten up a bit as the rally continues and pricing could make it back into Friday's range soon, but absent the 4.5 vs 4.0 production considerations combined with year end, the bottom line is that we're not getting "love" from lenders at the same pace we normally would. AQ's loan pricing comparison table gives you the details...
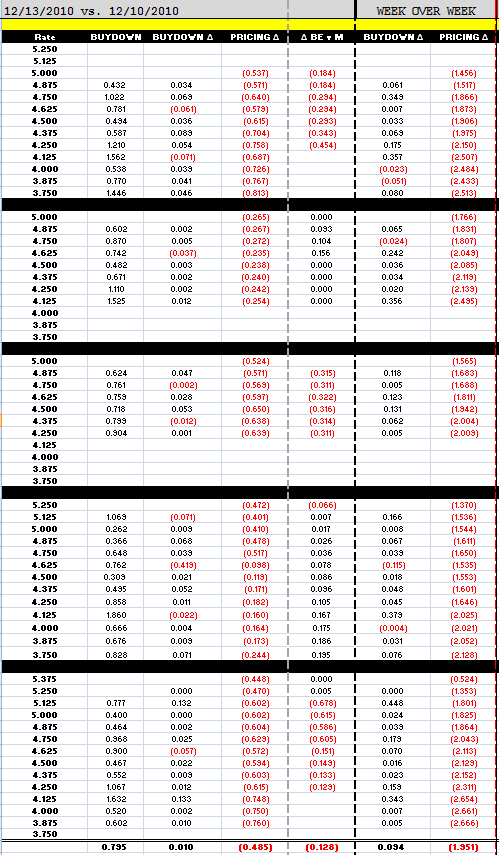
EXPLANATION OF LOAN PRICING COMPARISON
Buydowns are the cost of floating down to the next lowest note rate. Buydown costs are matched to the note rate in the same row. For example, the first number in the buydown column is .432%, this is the cost to float down from 5.00% to 4.875%, as a percentage of the loan amount. This is important because it helps an originator determine the best execution rate/points combination for a borrower who has a good idea of how long they intend to live in their home (breakeven on points paid vs. monthly payment savings). In the Buydown Delta column, red is cheaper. Black is more expensive.
The pricing change column is a direct rebate comparison of pricing today vs. pricing yesterday. Red is worse. Black is better.
The BE v M column shows you how margin is changing. RED means more margin. Black means less bps are baked into pricing.
-------------------------------------------
Benchmark 10 year notes have rallied off overnight price lows/yield highs. One of the factors being discussed as contributing the the rally is a long term retracement level being approached/touched in 10's, and that this presented a buying opportunity in what was being considered by some as an "oversold" treasury market. Zoomed in to a few days worth of viewing pleasure, you can see treasuries creeping back into Friday's range (before the monthly Treasury statement was released and the curve steepened further).

Rate sheet influential have performed better by comparison (MBS yields moving tighter to treasury yields), and as they've moved to recapture all of Friday's range, you can see why we wanted to discuss the primary/secondary spread issues again, because rebate should be as good or better when MBS are at these levels, yet that was not (and still might not be depending on your lender) the case today.
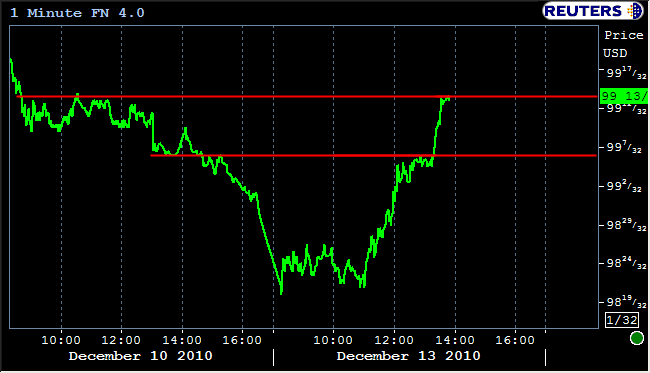
Nonetheless, a big bounce is exactly what we needed after this ugly morning. So we'll take it. I've found through the years that if you take the good, take the bad, and there you have it. On the bright side, we are seeing more reprices for the better right now.


