The BEA has released Q3 Advance GDP data. The "Advanced Report" is based on source data that are incomplete or subject to further revision by the source agency. The "second" estimate for the third quarter, based on more complete data, will be released on November 23, 2010.
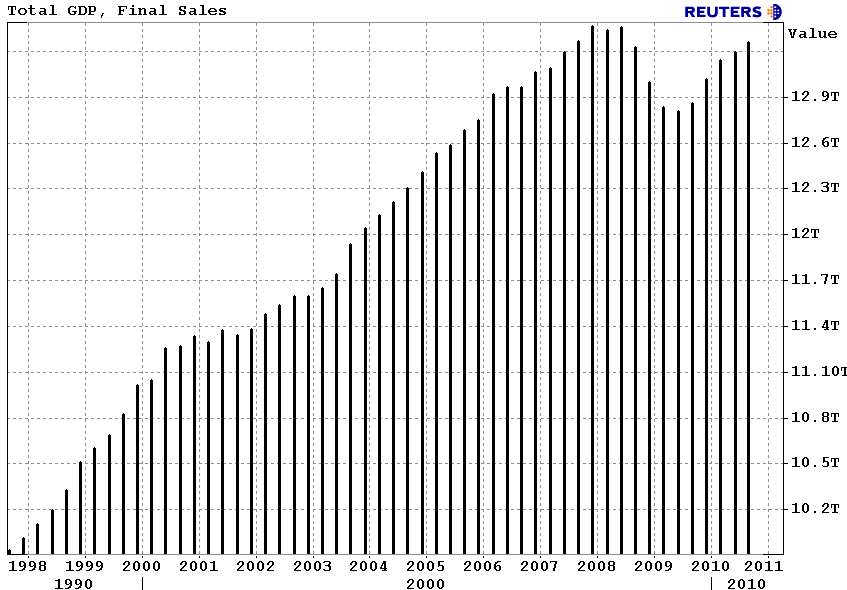
Real gross domestic product -- the output of goods and services produced by labor and property located in the United States -- increased at an annual rate of 2.0 percent in the third quarter of 2010, (that is, from the second quarter to the third quarter), according to the "advance" estimate released by the Bureau of Economic Analysis. In the second quarter, real GDP increased 1.7 percent.
The increase in real GDP in the third quarter primarily reflected positive contributions from personal consumption expenditures (PCE), private inventory investment, nonresidential fixed investment, federal government spending, and exports that were partly offset by a negative contribution from residential fixed investment. Imports, which are a subtraction in the calculation of GDP, increased.
The small acceleration in real GDP in the third quarter primarily reflected a sharp deceleration in imports and accelerations in private inventory investment and in PCE that were partly offset by a downturn in residential fixed investment and decelerations in nonresidential fixed investment and in exports.
Reuters Quick Recap...
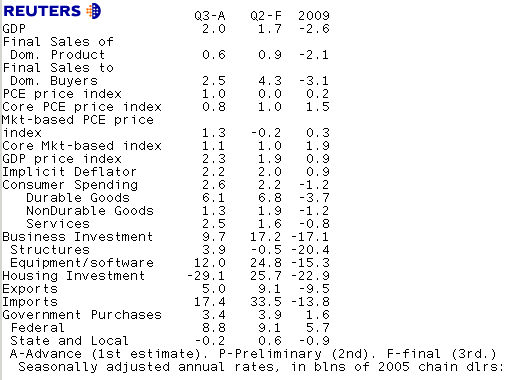
- RTRS-US ADVANCE Q3 GDP +2.0 PCT (CONSENSUS +2.0 PCT), Q2 +1.7 PCT; FINAL SALES +0.6 PCT (CONS +1.2 PCT), Q2 +0.9 PCT
- RTRS-US ADVANCE Q3 GDP DEFLATOR +2.2 PCT (CONS +1.9 PCT), Q2 +2.0 PCT
- RTRS-US Q3 PCE PRICE INDEX +1.0 PCT (CONS +1.2 PCT), Q2 0.0 PCT; CORE PCE +0.8 PCT (CONS +1.0 PCT), Q2 +1.0 PCT
- RTRS-US Q3 CONSUMER SPENDING +2.6 PCT, LARGEST RISE SINCE Q4 2006, (Q2 +2.2 PCT); DURABLES +6.1 PCT (Q2 +6.8 PCT)
- RTRS-US Q3 MARKET-BASED PCE PRICE INDEX +1.3 PCT (Q2 -0.2 PCT), CORE +1.1 PCT (Q2 +1.0 PCT)
- RTRS-US Q3 BUSINESS INVESTMENT +9.7 PCT (Q2 +17.2 PCT), EQUIPMENT/SOFTWARE +12.0 PCT (Q2 +24.8 PCT)
- RTRS-US Q3 HOME INVESTMENT -29.1 PCT (Q2 +25.7 PCT), BUS. INVESTMENT IN STRUCTURES +3.9 PCT (Q2 -0.5 PCT)
- RTRS-US Q3 EXPORTS +5.0 PCT (Q2 +9.1 PCT), IMPORTS +17.4 PCT (Q2 +33.5 PCT)
- RTRS-US Q3 GDP EX MOTOR VEHICLES +1.6 PCT (Q2 +1.8 PCT)
- RTRS-US Q3 YEAR-ON-YEAR PCE PRICE INDEX +1.4 PCT (Q2 +1.9 PCT), CORE PCE +1.3 PCT (Q2 +1.5 PCT)
- RTRS-US Q3 BUSINESS INVENTORY CHANGE +$115.5 BLN (Q2 +$68.8 BLN)
- RTRS-US Q3 BUSINESS INVENTORY CHANGE ADDS 1.44 PERCENTAGE POINT TO GDP CHANGE
RTRS-TABLE - U.S. Q3 GDP rose 2.0 percent
Things that stood out to me....
- BOND MARKET BULLISH: The change in real private inventories added 1.44 percentage points to the third-quarter change in real GDP after adding 0.82 percentage point to the second-quarter change. Private businesses increased inventories $115.5 billion in the third quarter, following increases of $68.8 billion in the second quarter and $44.1 billion in the first. Real final sales of domestic product -- GDP less change in private inventories -- increased 0.6 percent in the third quarter, compared with an increase of 0.9 percent in the second.
- BOND MARKET BEARISH: Real personal consumption expenditures increased 2.6 percent in the third quarter, compared with an increase of 2.2 percent in the second. Durable goods increased 6.1 percent, compared with an increase of 6.8 percent. Nondurable goods increased 1.3 percent, compared with an increase of 1.9 percent. Services increased 2.5 percent, compared with an increase of 1.6 percent.
- BOND MARKET BULLISH: Real residential fixed investment decreased 29.1 percent, in contrast to an increase of 25.7 percent.
- BOND MARKET BULLISH: The price index for gross domestic purchases, which measures prices paid by U.S. residents, increased 0.8 percent in the third quarter, compared with an increase of 0.1 percent in the second. Excluding food and energy prices, the price index for gross domestic purchases increased 0.6 percent in the third quarter, compared with an increase of 0.8 percent in the second, and an increase of 1.6 percent in Q1 (APPENDIX A TABLE A)
Plain and Simple: GDP data was on the screws. A few things stood out to me. Weakness in the housing market is VERY OBVIOUS....see the 29.1% decline in housing investment. This is one the primary sources of slowness in the economic recovery. Food and energy prices paid by consumers are on the rise, this will be useful data in the Fed's effort to increase inflationary expectations, which hopefully leads the folks who have jobs to request higher wages (cost push inflation leads to demand pull inflation, hopefully). Unfortunately when you strip out food and energy prices there isn't much upward pressure on consumer price levels, core inflation slowed from +0.8% to +0.6%. On the bright side, consumer spending did improve, led by expenditures in the servicing sector, demand for durable goods was down. Another sign of a fragmented recovery....without inventory rebuilding, GDP increased by only 0.6% in Q3. QEII is coming.
(BOND MARKET BEARISH: check out the 55.4% increase in business spending on computers!)
Market Reaction...
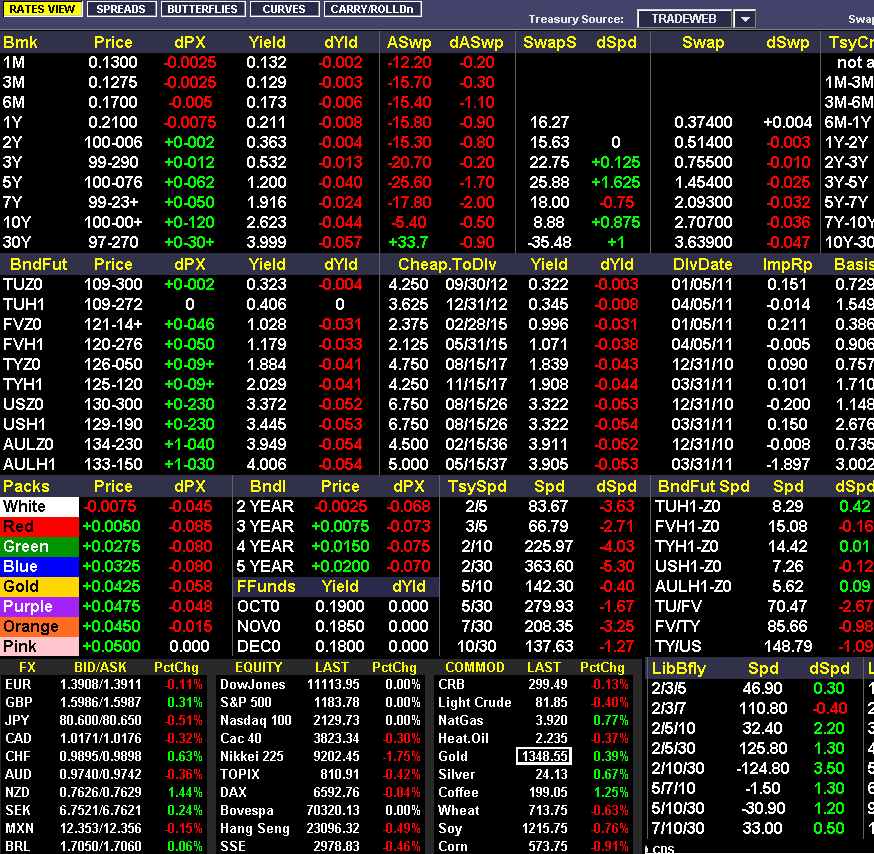
10s rallied 3bps are are currently +12/32 at 100-00+ yielding 2.623%. 2s/10s curve bull flattens 2 more bps to 226bps wide. 2s/30s 5 bps flatter at 363bps.
FNCL 3.5s rally. FNCL 4.0s rally. Loan pricing will be better.
I need to come up with a Halloween costume in the next 24-hours. Any ideas?


