
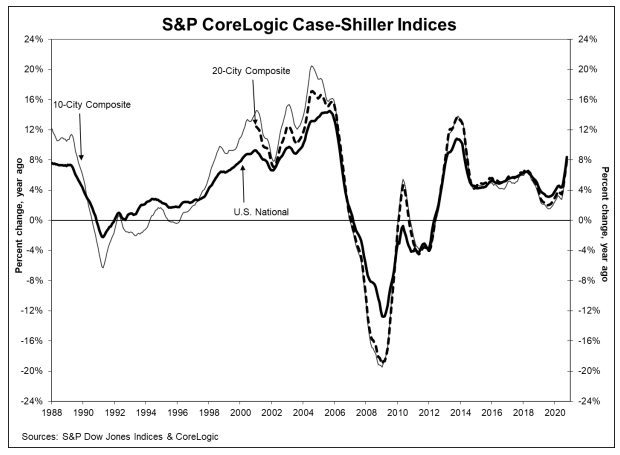
The headline for the October S&P CoreLogic Case-Shiller home price report is yet another month of escalating gains. The National Home Price Index which covers all nine U.S. census divisions posted an annual increase of 8.4 percent compared to a 7.0 percent change in September. The National Index posted a 1.4 percent month-over-month increase before seasonal adjustment and 1.7 percent afterward.
The 10-City Composite Index was up 7.5 percent from the previous October and the 20-City Composite grew by 7.9 percent. Their September gains were 6.2 percent and 6.6 percent, respectively. The 10-City index was up 1.4 percent before seasonal adjustment and the 20-City posted a 1.3 percent change. Both composites rose 1.6 percent after adjustment.
COVID-19 related delays in reporting are still affecting Wayne County Michigan so Detroit is not included in the indices.
Phoenix, Seattle, and San Diego continued to report the highest year-over-year gains among the 19 cities (excluding Detroit) in October. Phoenix was again in the lead with a 12.7 percent year-over-year price increase. Seattle's appreciation rate was 11.7 percent and San Diego home prices rose 11.6 percent. All 19 cities reported higher price increases in the year ending October 2020 versus the year ending September 2020.
"The surprising strength we noted in last month's report continued into October's home price data," says Craig J. Lazzara, Managing Director and Global Head of Index Investment Strategy at S&P Dow Jones Indices. "We've noted before that a trend of accelerating increases in the National Composite Index began in August 2019 but was interrupted in May and June, as COVID-related restrictions produced modestly decelerating price gains. Since June, our monthly readings have shown accelerating growth in home prices, and October's results emphatically emphasize that trend. The last time that the National Composite matched this month's 8.4 percent growth rate was more than six and a half years ago, in March 2014. Although the full history of the pandemic's impact on housing prices is yet to be written, the data from the last several months are consistent with the view that COVID has encouraged potential buyers to move from urban apartments to suburban homes. We'll continue to monitor what the data can tell us about this question.
"Phoenix's 12.7 percent increase led all cities for the 17th consecutive month. Seattle (11.7 percent) and San Diego (11.6 percent) repeated in second and third place. Prices were strongest in the West and Southwest regions, but even the comparatively weak Midwest and Northeast (up 7.7 percent and 7.9 percent respectively) performed creditably well."
CoreLogic Deputy Chief Economist Selma Hepp noted, "As the last housing market indicator in 2020, the Case Shiller Index finishes the year on a high note, characterizing the market during this otherwise tumultuous year. The national Case-Shiller Index jumped 8.41 percent in October - a new high- and is growing at the fastest pace since March 2014. The index is now 25 percent above the peak reached during pre-Great Recession. The month-to-month index jumped 1.37 percent from September, making it the fastest increase since spring 2013.
"Looking ahead, 2021 will present a new set of challenges both for the economy and the housing market," Hepp said. "While distribution of coronavirus vaccinations is underway, there may still be some bumps along the way to economic recovery. Fortunately, some critical economic stimulus support appears to also be underway soon, hopefully buffering the impacts of recent shutdowns. Depending on the path of the pandemic over the next few months, policy makers may opt to extend foreclosure moratoriums, in addition to recent extension of rent eviction moratoriums, which will help struggling homeowners and renters. Taken together, recent stimulus actions are likely to help housing market demand and ensure continued home price growth."
The S&P CoreLogic Case-Shiller Home Price Indices are constructed to accurately track the price path of typical single-family home pairs for thousands of individual houses from the available universe of arms-length sales data. The National U.S. Home Price Index tracks the value of single-family housing within the United States. The indices have a base value of 100 in January 2000; thus, for example, a current index value of 150 translates to a 50 percent appreciation rate since January 2000 for a typical home located within the subject market.
As of October 2020, the National Index was at 229.93 compared to 226.80 in September. The 10- and 20-City Composites had readings of 248.58 and 236.77, up from 245.02 and 232.53 the prior month. Los Angeles has the highest index reading at 312.49 and Cleveland (absent data on Detroit) the lowest at 139.83.


