
Home prices continue to confound predictions of decelerating gains. The S&P/Case-Shiller National Home Price Index gained 5.2 percent over the 12 months period ended in October - up from the 4.9 percent gain reported for year-over-year for September. The Index, which covers all nine U.S. census divisions, was up 0.1 percent from September to October this year.
Case-Shiller's 10-City Composite Index increased on a year-over-year basis by 5.2 percent compared to a 12-month gain in September of 4.9 percent. The 20-City also accelerated from the previous month with an annual gain of 5.5 percent versus 5.4 percent in September.
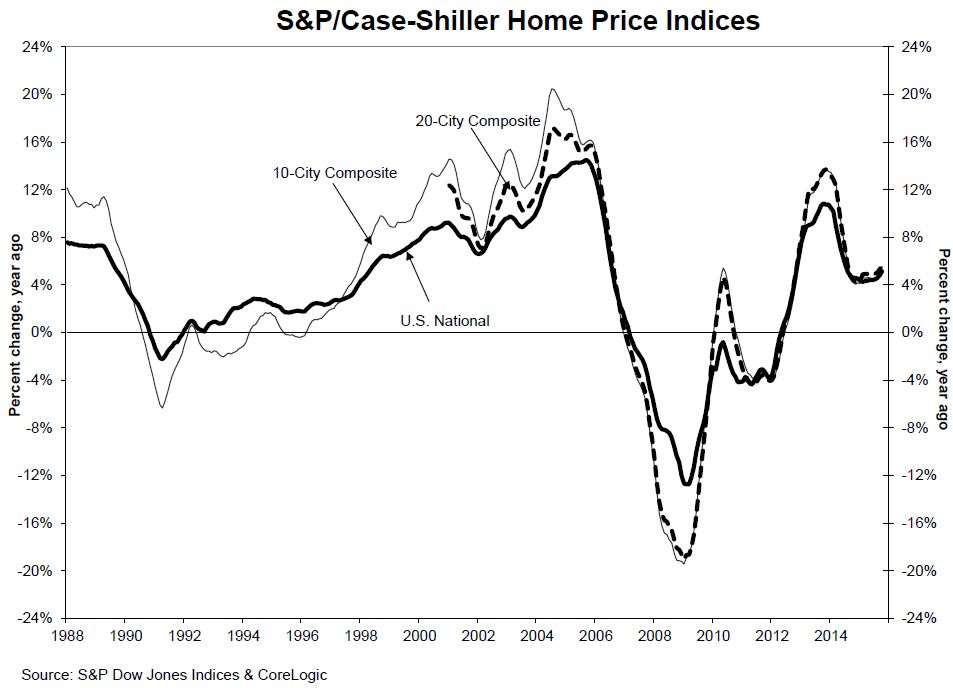
Twelve of the 20 cities covered by Case-Shiller had greater annual price gains in October than in September. San Francisco, Denver, and Portland (Oregon) continue to report the highest gains and again those gains were in double digits - 10.9 percent for all three. Phoenix has the longest streak, its 5.7 percent increase in October was the 11th consecutive gain.
The National Index posted a gain of 0.1 percent from September to October on a non-seasonally adjusted basis and was up 0.9 percent adjusted. The 10-City was unchanged and the 20-City ticked up 0.1 percent unadjusted. Both city composites increased 0.8 percent adjusted. All 20 cities reported gains after seasonal adjustment but only half did so before it.
David M. Blitzer, Managing Director and Chair of the Index Committee said "Generally good economic conditions continue to support gains in home prices. Among the positive factors are consumers' expectations of low inflation and further economic growth as well as recent increases in residential construction including single family housing starts. Inventories of existing homes have averaged around a five month supply for the past year, a level that suggests a fairly tight market with limited supplies. Sales of new single family homes, despite recent increases in construction, remain mixed to soft compared to the trend in existing home sales.
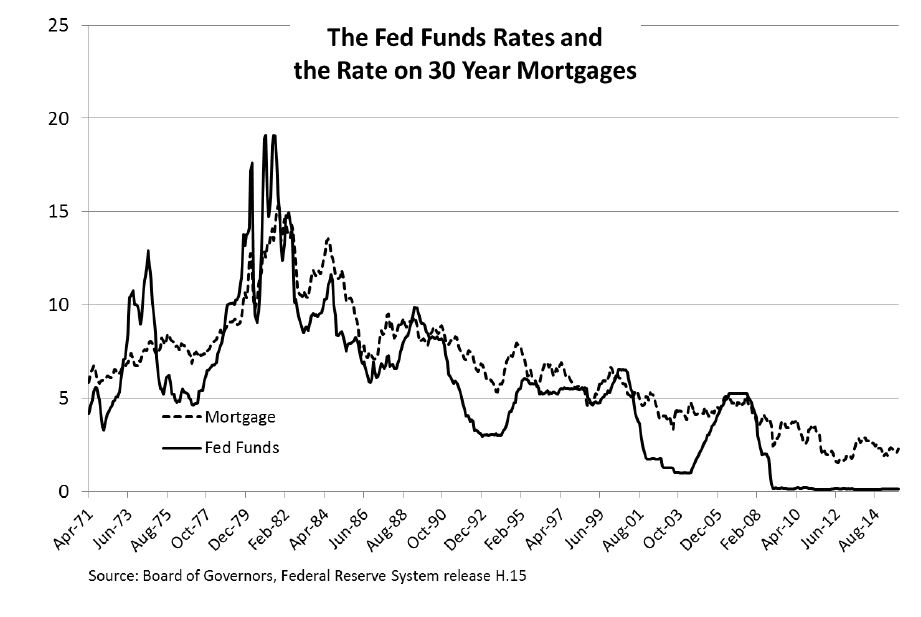
"The recent action by the Federal Reserve raising the Fed funds target rate by 25bp and spreading expectations of further increases during 2016 are leading some to wonder if mortgage interest rates might rise" Blitzer said. "Typically, increases in short term interest rates lead to smaller increases in long term interest rates. The chart below shows the average rate on 30-year fixed rate mortgages and the Fed funds rate. From May 2004 to July 2007, the Fed funds rate moved up from 1.0 percent to 5.25 percent; over the same period, the mortgage rate rose from about 6 percent to 6.75 percent during a sustained tightening effort by the Federal Reserve. The latest economic projections published by the Fed following the recent rate increase suggest that the Fed funds rate will be around 2.6 percent in September 2017 compared to a current rate of about 0.5 percent. These data suggest that potential home buyers need not fear runaway mortgage interest rates."
As of October the average home prices of cities in the two composite indices are back to levels in the winter of 2007. Measured from the June/July 2006 peaks the composites are down by approximately 11 to 13 percent. Since hitting their post-crash lows in March 2012 the 10-City has recovered by 34.9 percent and the 20-City by 36.4 percent.

The S&P/Case-Shiller Home Price Indices are constructed to accurately track the price path of typical single-family home pairs for thousands of individual houses from the available universe of arms-length sales data. The S&P/Case-Shiller National U.S. Home Price Index tracks the value of single-family housing within the United States. The indices have a base value of 100 in January 2000; thus, for example, a current index value of 150 translates to a 50% appreciation rate since January 2000 for a typical home located within the subject market.
The 10-City Composite currently has an index level of 197.62 and the 20-City a value of 182.83. The National Index is at 175.65. Detroit is the city with the lowest index at 103.39 and Los Angeles has the highest at 238.96.


