
While home prices continued to decline in October, the S&P/Case-Shiller Home Price Indices released on Tuesday indicate that the downward trend may be slowing if only by a bit. The 10- and 20-City Composite Indices fell 1.1 percent and 1.2 percent in October as compared to September and were down 3.0 percent and 3.4 percent from one year earlier. Nineteen of the 20 cities, Phoenix being the lone exception, posted lower prices in October than in September. On the marginally positive side, for both Composites and 14 of their 20 cities the year-over-year loss in October was smaller than it had been in September. Washington, DC and Detroit were the only two metropolitan areas to posted positive annual returns, 1.3 percent and 2.5 percent respectively.

David M. Blitzer, Chairman of the Index Committee at S&P Indices said of the October data, "The only good news is some improvement in the annual rates of change in home prices. The crisis low for the 10-City Composite was back in April 2009, whereas it was a more recent March 2011 for the 20-City Composite. The 10-City Composite is about 2.4 percent above its relative low, and the 20-City composite is about 1.9 percent."
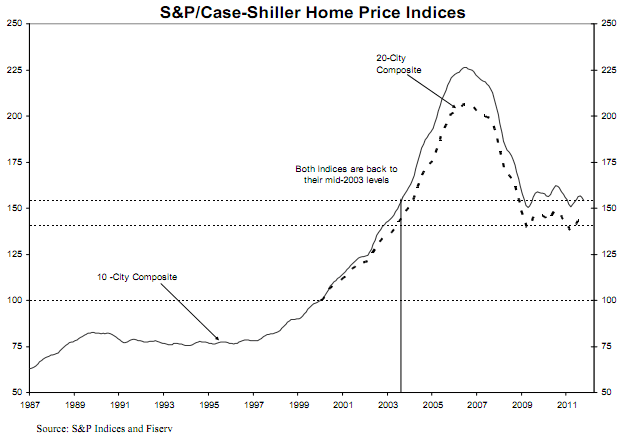
The chart above shows the index levels for the two composites in comparison with their peaks and troughs. As of October average home prices in the U.S. are at the approximate levels they held in mid-2003. Measured from the mid-2006 price peaks, the 10-City and 20-City Composites are down 31.9 percent and 32.1 percent respectively and have recovered from their recent lows by 2.4 percent and 1.9 percent.
Blitzer said that Atlanta and the Midwest are areas that really stand out in terms of recent relative weakness. "Atlanta was down 5.0 percent over the month, after having fallen by 5.9 percent in September. It also has the weakest annual returns, down 11.7 percent. Chicago, Cleveland, Detroit and Minneapolis all posted monthly declines of 1.0 percent or more in October. These markets were some of the strongest during the spring/summer buying season. However, Detroit is the healthiest when viewed on an annual basis. It is up 2.5 percent versus October 2010. Atlanta, Cleveland, Detroit, and Las Vegas are four markets where average prices are below their January 2000 levels, and Atlanta and Las Vegas posted new lows in October."
The fourteen metro areas showing smaller annual losses in October than September were Boston, Charlotte, Chicago, Cleveland, Dallas, Denver, New York, Phoenix, Portland, San Diego, San Francisco, Seattle, Tampa and Washington, DC. A fifteenth city, Miami, was unchanged.
The S&P/Case-Shiller Indices are constructed to track the price path of typical single-family homes in the targeted metropolitan areas. The indices have a base value of 100 set in January 2000. Thus an index of 150 indicates a typical home in the area has appreciated 50 percent from the base period. The current 10-City Index is 154.10 and 20 City is 140.30. Individual cities range from 71 in Detroit to 165.51 in Los Angeles.


