
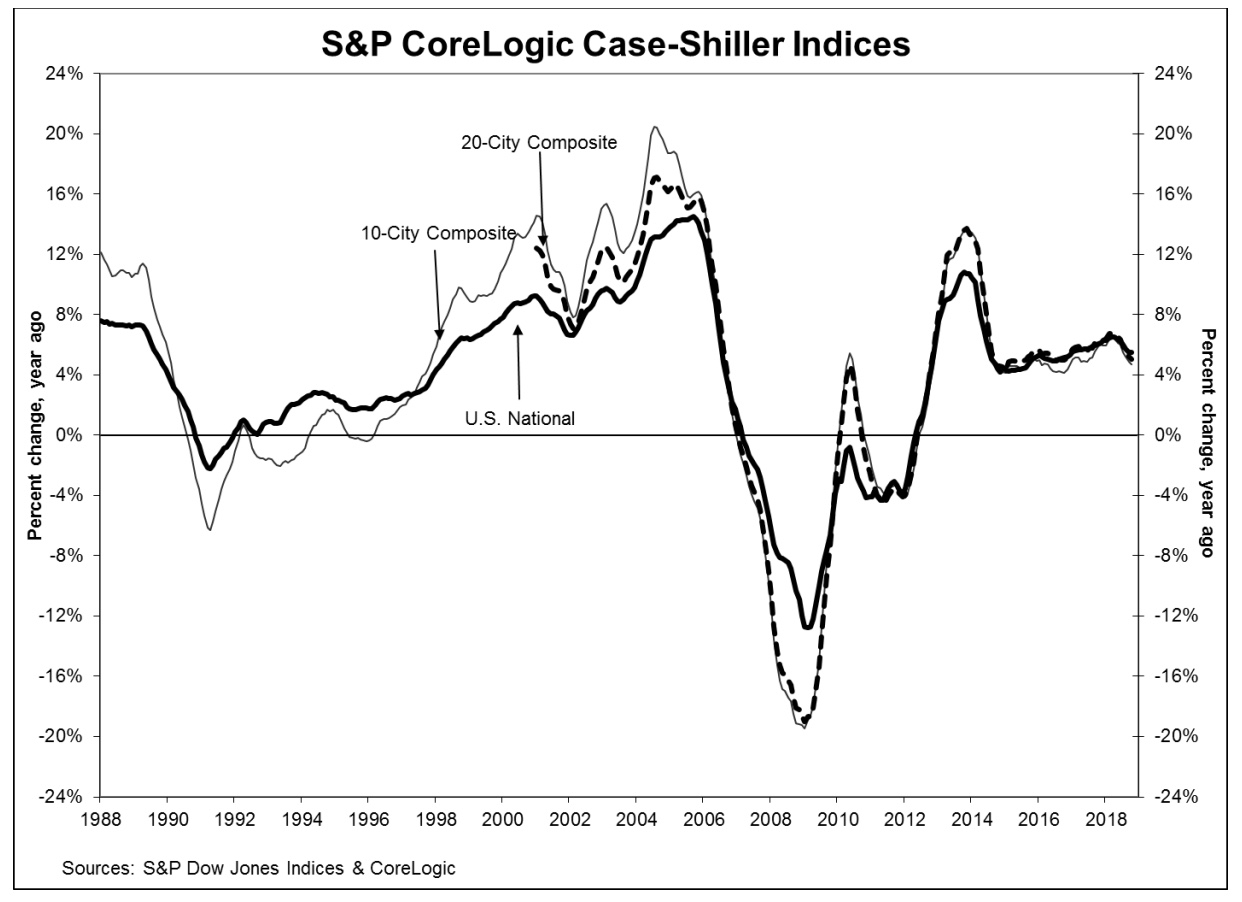
Home prices continued to ratchet down their advances in October, fewer than half of the tracked cities saw prices increase on an unadjusted basis. The slowing is also beginning to show up in the annual readings. The Case-Shiller National Home Price Index which covers all nine U.S. census divisions, reported a 5.5 percent annual gain in October, unchanged from the year-over-year reading in September. That index had not been below 6.0 percent for a year until it dropped to 5.7 percent in August. Before seasonal adjustment the National Index managed a 0.1 percent gain for the month and 05 percent after adjustment.
The 10-City Composite was up year-over-year by 4.7 percent, down from 4.9 percent the previous month and the 20-City Composite posted a 5.0 change, also 0.2 point lower than in September. Neither of the composites reported any change for the month on an unadjusted basis, but after seasonal adjustment the 10-City Composite was up 0.5 percent and the 20-City Composite gained 0.4 percent. Nine of 20 cities reported increases before seasonal adjustment, while 18 of 20 cities reported increases afterward.
Seattle, for the first time in recent memory, was not among the fastest appreciating cities. Las Vegas led the way with a 12.8 percent pace followed by San Francisco with a 7.9 percent gain. Phoenix was the new entry at 7.7 percent. Month-over-month prices in Seattle declined for the second consecutive month and its annual increase is now 7.3 percent. Six of the 20 cities reported greater price increases in the year ending October 2018 versus the year ending September 2018.
"Home prices in most parts of the U.S. rose in October from September and from a year earlier," says David M. Blitzer, Managing Director and Chairman of the Index Committee at S&P Dow Jones Indices. "The combination of higher mortgage rates and higher home prices rising faster than incomes and wages means fewer people can afford to buy a house. Fixed rate 30-year mortgages are currently 4.75 percent, up from 4 percent one year earlier. Home prices are up 54 percent or 40 percent excluding inflation, since they bottomed in 2012. Reduced affordability is slowing sales of both new and existing single-family homes. Sales peaked in November 2017 and have drifted down since then.
"The largest gains were seen in Las Vegas where home prices rose 12.8 percent in the last 12 months, compared to an average of 5.3 percent across the other 19 cities. This is a marked change from the housing collapse in 2006-12 when Las Vegas was the hardest hit city with prices down 62 percent. After the last recession, Las Vegas diversified its economy by adding a medical school, becoming a regional center for health care, and attracting high technology employers. Employment is increasing 3 percent annually, twice as fast as the national rate."
All three Case-Shiller indices are above their previous peaks in the summer of 2006. The National Index is 11.6 percent higher while the 10-City and 20-City have added 0.6 percent and 3.6 percent respectively to their previous records.
The S&P CoreLogic Case-Shiller Home Price Indices are constructed to accurately track the price path of typical single-family home pairs for thousands of individual houses from the available universe of arms-length sales data. The National U.S. Home Price Index tracks the value of single-family housing within the United States. The indices have a base value of 100 in January 2000; thus, for example, a current index value of 150 translates to a 50 percent appreciation rate since January 2000 for a typical home located within the subject market.
The National Index set another new record in October, a reading of 206.03. September's peak was 205.82. The 10- and 20-City Composites had readings of 227.65 and 213.89 respectively. Los Angeles claims the highest index at 283.03. Cleveland had the lowest reading at 123.85, down from 124.26 in September.


