
We know that home price growth is slowing, and cash-out refinancing has been coming back, still it is a bit of a stunner to find that homeowner equity actually declined in the third quarter of this year. Black Knight's current issue of its Mortgage Monitor reports that the amount of total equity (home value net of mortgage balance) held nationally by homeowners at the end of the third quarter was down by $160 billion compared to the second quarter of the year and now totals $9.8 trillion.
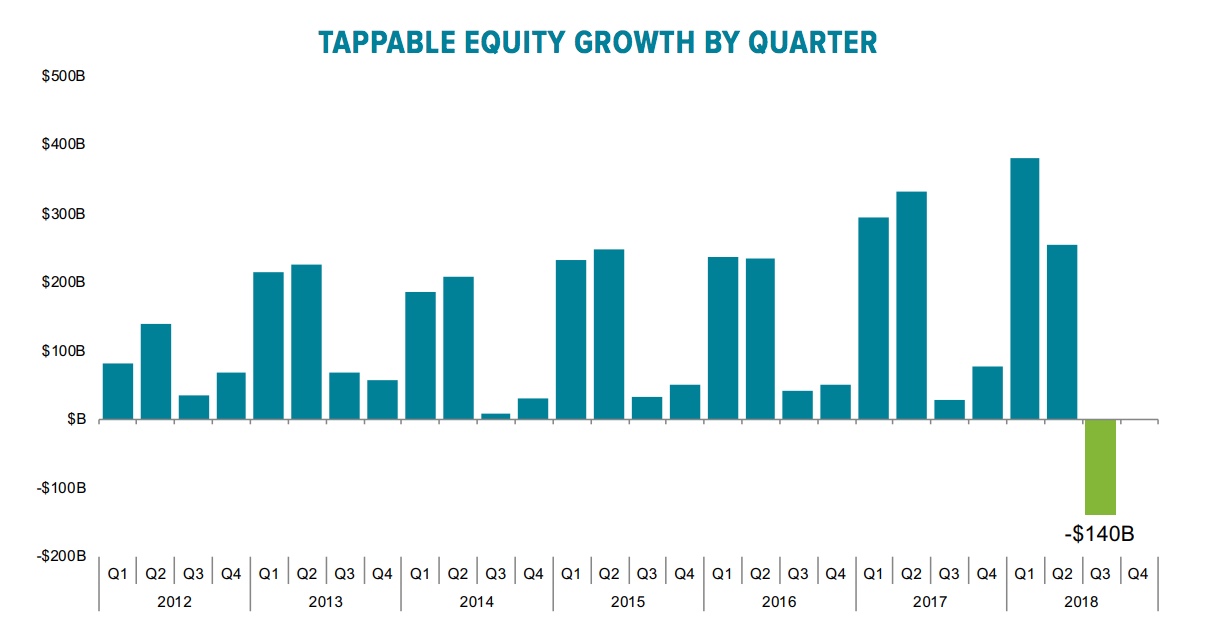
Of that total, $5.9 trillion is considered "tappable," that is equity that can be withdrawn by the homeowner without hitting a maximum 80 percent combined loan-to-value (CLTV) ratio. That also fell, down by $140 billion quarter-over-quarter, the first decline since the housing recovery began in 2012.
Both the number of homeowners who have tappable equity and the borrowing power held by those who do also declined. There are 43.6 million homeowners with tappable equity, 272,000 fewer than at the end of the second quarter of 2018. The average homeowner with more than 20 percent equity has $136,000 available to withdraw through cash-out refinancing or a home equity line of credit (HELOC), about $2,300 less than before. Tappable equity growth hit a high in the first quarter of the year but has pulled back noticeably, not just in the third quarter, but the second as well. However, in the third quarter one-fifth of the growth in the first half of the year evaporated.
The Monitor says the decline was driven by softening in some of the nation's most expensive and equity-rich markets. Seventy-five percent of the disappearing equity was in California, and four metro areas, San Jose, San Francisco, Los Angeles, and Seattle, accounted for two-thirds of the downturn. All were areas where home price gains had been far more aggressive than the national average, driving much of the fast equity growth reported in prior editions of the Monitor. Home prices declined by 1 percent in Los Angeles and 4 percent in San Jose.
But these were not isolated cases; tappable equity fell in 60 of the 100 largest metro areas and in 23 states. Still, 98 percent of metro areas saw tappable equity increase year-over-year and nationally there was a 10 percent gain. Through the end of the third quarter homeowners have seen equity growth of $518 billion in 2018, 20 percent less than during the same period in 2017.
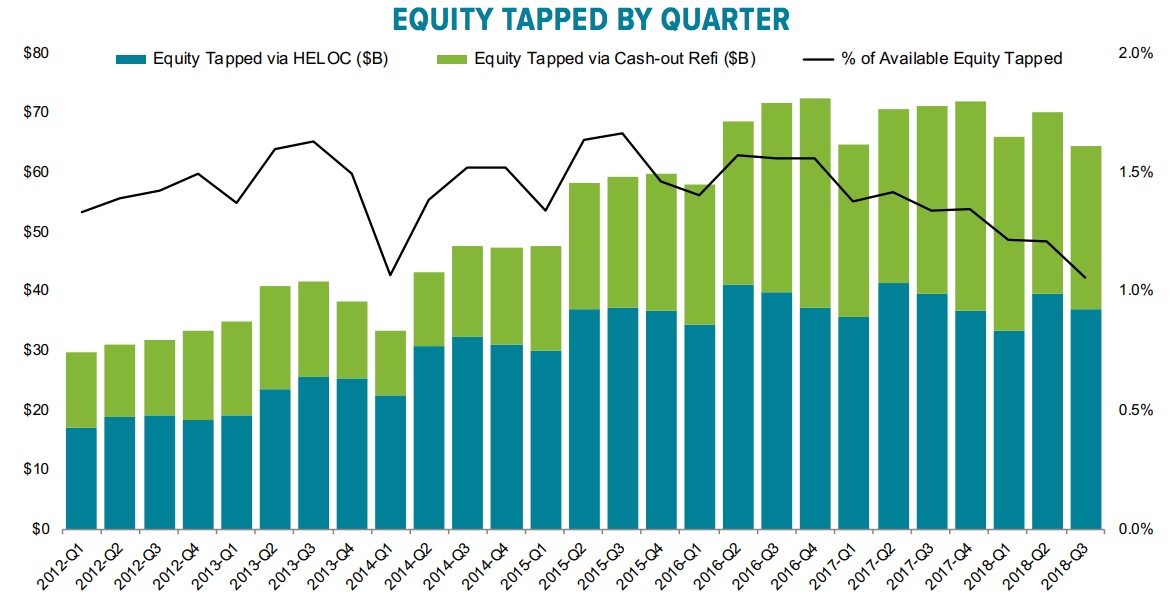
Even though the third quarter is traditionally the strongest of the year for HELOC withdrawals, homeowners tapped 8 percent less equity through either those or through cash-out refinances than in the second quarter and 10 percent less than in the third quarter of last year, a total of $640 billion or 1.06 percent of the equity that was available. This was within 0.01 percent of the lowest withdrawal rate on record. Withdrawals as a share of available equity have now declined in four of the last five, and nine of the past 12 quarters.
The Monitor also noted that the for-sale inventory of homes, which hit a post-recession low in January, is now 2 percent higher than a year ago, the first annual quarter-to-quarter gain in more than four years. The increase is comparable to a similar uptick in 2013-2014 when rising interest rates accompanied the so-called "Taper Tantrum" and put pressure on the buy side of the housing equation.
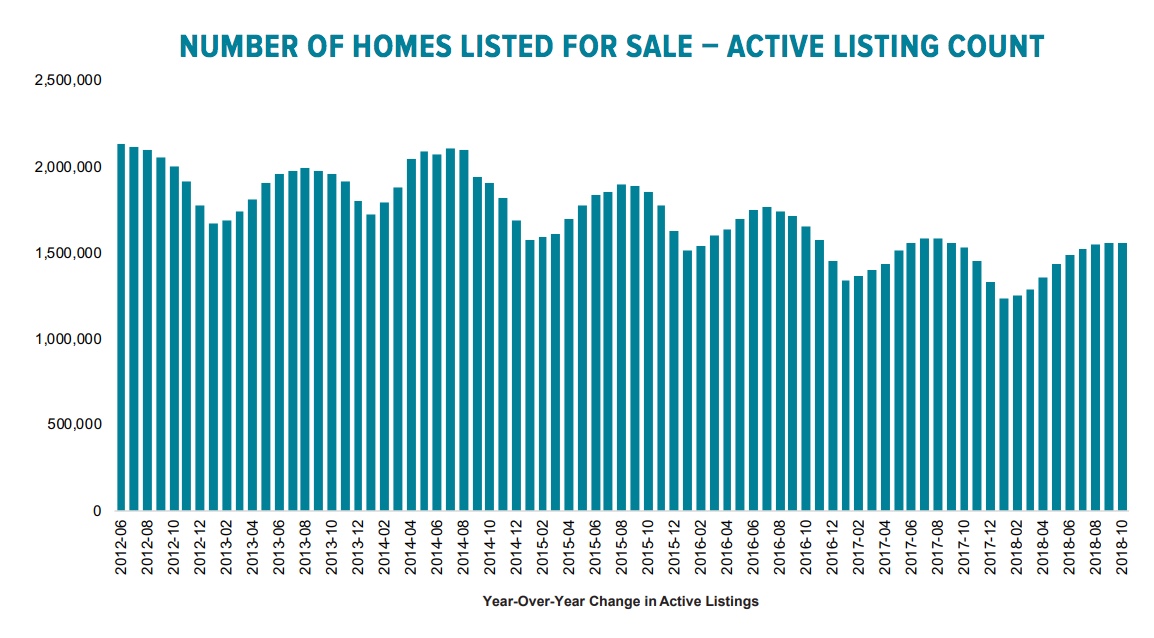
Mapping the rise in inventory against 30-year rates indicates that the current listing gains maybe slightly lower and more delayed than expected from comparisons with that 2013-2014 scenario as well as with another period of increasing rates in 2015-2016. Black Knight speculates that this may be due to homeowners who are unwilling to give up the low interest rates on their current mortgages by selling the home.

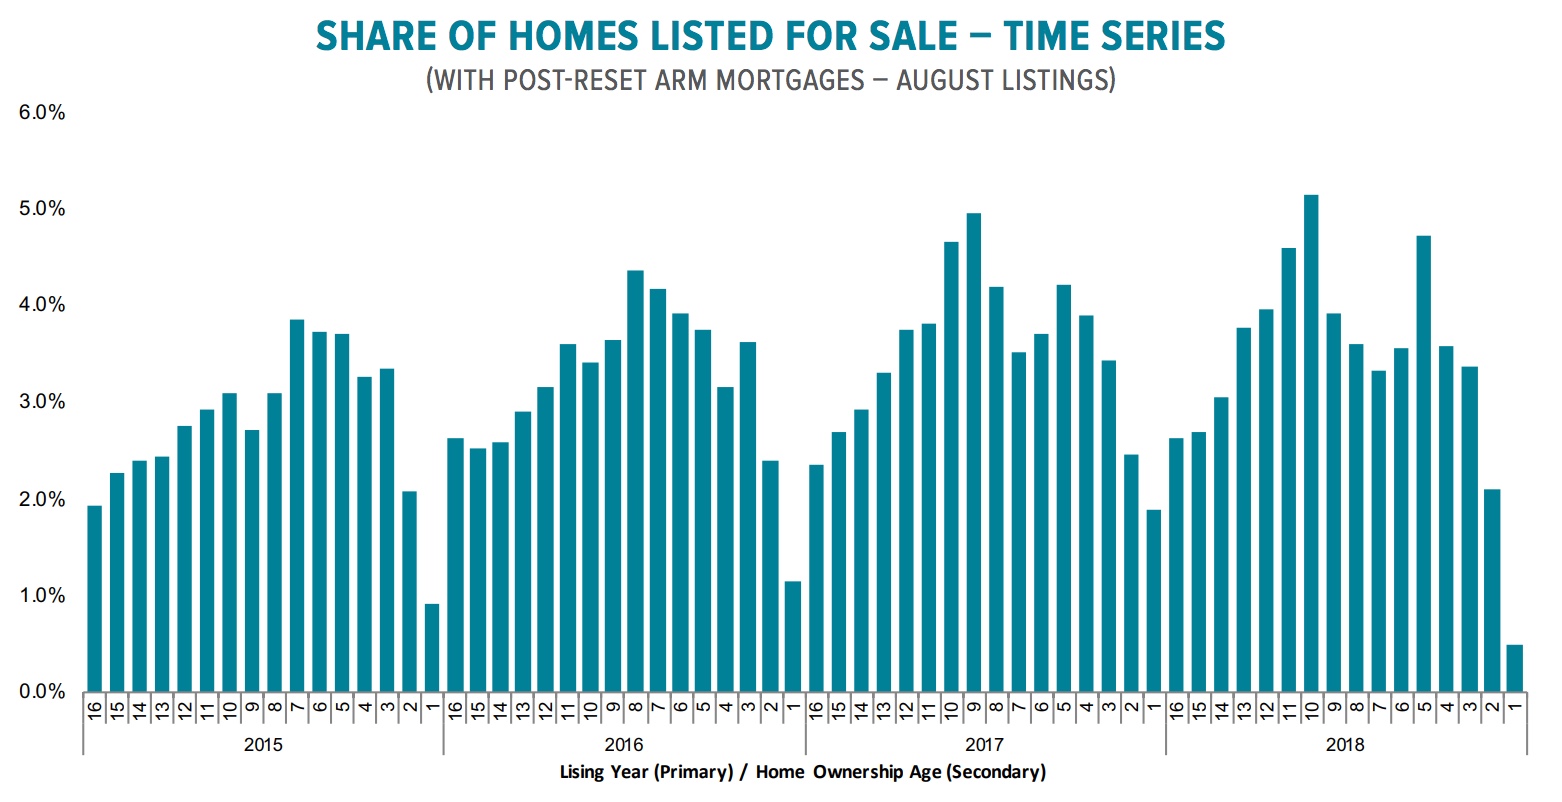
To that point, Black Knight points to its past reports on the differing listing rates of homeowners with fixed versus adjustable rate mortgages (ARMs). The latter are twice as likely to list their homes than those with fixed rates. Homeowners with lower rates, whether fixed or adjustable, are also less likely to list than those with higher rates, regardless of loan category.
In order to accurately predict the impact of rate lock, the company analyzed rates in conjunction with the age of the loan. Years 6 to 8 of home ownership are usually the prime selling years with rates falling off noticeably after year 10. But the chart shows a clear shift in that pattern in the last two years.
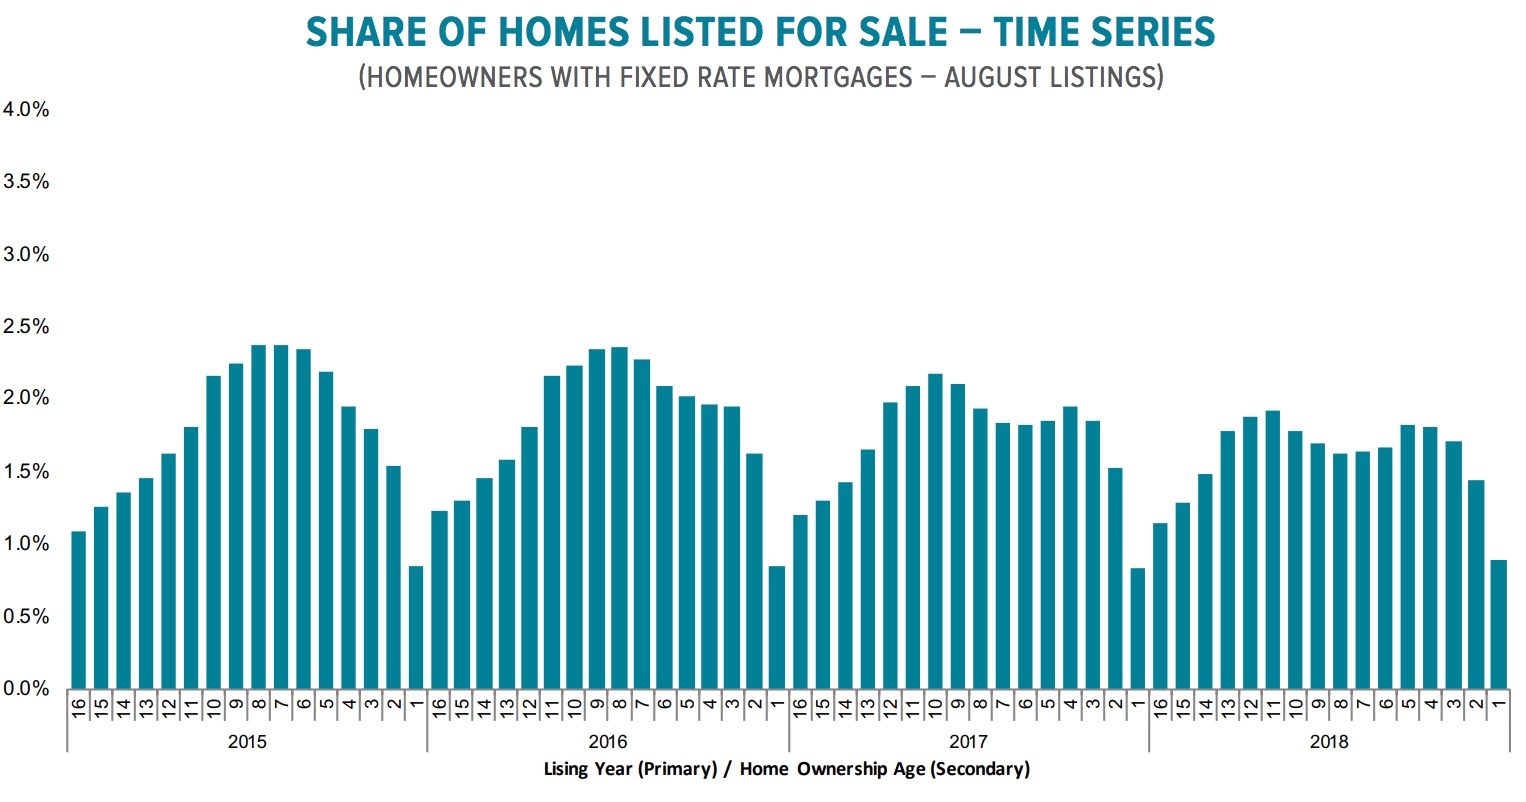
Overlaying listings with homeowner tenure in 2015 through 2018 shows a pocket of "missing" listings in what should be strong listing years and Black Knight estimates that gap at 100,000 homes; a 6 percent suppression of existing home sale inventory. However, the analysis says, given that chart is limited to listings with fixed rate mortgages, it is tempting to put this gap off as "rate lock."

But when the analysis was repeated for ARMs, specifically those already in their reset period, the same pattern was noted. These missing listings indicate that rate lock is not the only driver of the suppression.
Black Knight then repeated the analysis across interest rate buckets. The expectation was that homeowners with low rates would be less likely to list, and this was apparent. However, the missing pockets of listings also occurs where interest rates are above 5 percent, a group that should not be constrained by rate lock. Black Knight says this suggests that home prices, not rates, could be a significant or even the predominant driver.
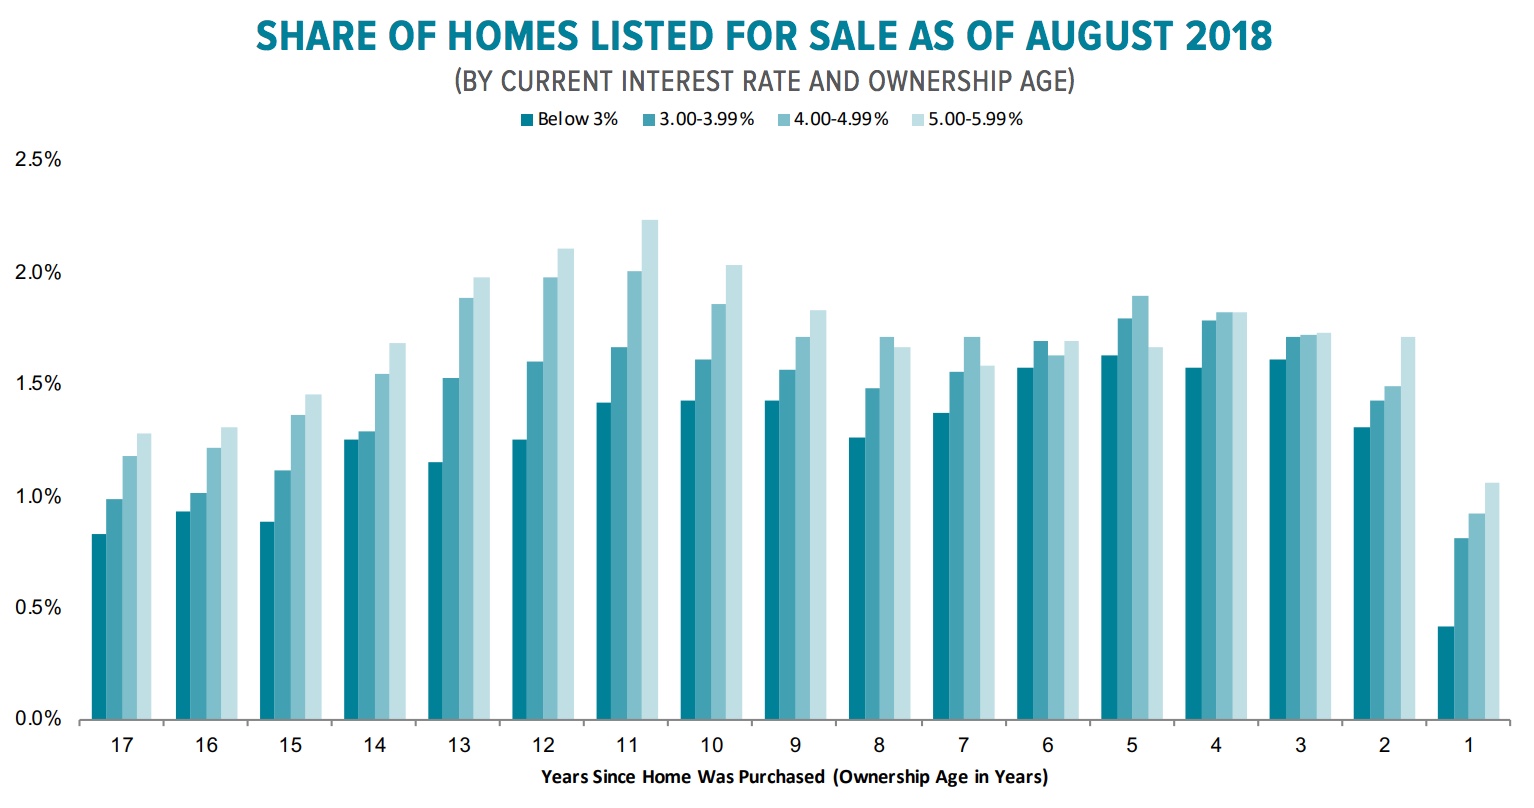
Homes purchased at or near the bottom of the market in 2012 are among those clearly showing the most obvious listing suppression. At that point the average sales price was $199,000 and interest rates hit a low of 3.35 percent. Today that same home would cost 50 percent more and the interest rate is at least 1.5 percentage point higher. The $741 mortgage payment on that house in 2012 would be $1257 today, a 70 percent increase.
Thus, Black Knight concludes, this rate/price constraint on the supply of existing homes may be countering what might otherwise be greater downward pressure on home prices. Even with more homes to choose from, listings are still selling fast. Median days on the market during the quarter rose by five days to 68 compared to a year ago. This will probably change as inventories increase.


