
The Housing Finance Policy Center, part of the Urban Institute, has released a new measure of credit availability. In an article in the Urban Institute's blog, Metro Blog, Wei Li and Laurie Goodman talk about the initial findings from their measure, the Credit Availability Index or HCAI, that product not borrower risk fueled the housing bubble.
We will return to those findings later, but first an explanation of how the Index is calculated and, more interestingly, how the authors compare it to others that attempt to measure credit accessibility; the Federal Reserve's Senior Loan Officer Opinion Survey on Bank Lending Practices (SLO), mortgage application denial rates based on annual Home Mortgage Disclosure Act (HMDA) data; the Mortgage Credit Availability Index produced by the Mortgage Bankers Association (MBA), and median borrower's credit score at origination. Li and Goodman claim these measures suffer variously from being too narrow, too subjective, limited in time, opaque, or inaccurate in certain situations.
While each has covered a different time frame, this is how these indices have measured credit availability.
The quarterly SLO measures credit accessibility qualitatively by calculating the net share of banks that report having tightened standards over the previous three months "considerably" or "somewhat" minus the fraction of banks that reported having eased standards in such measure. Sixty large domestically chartered commercial banks currently complete this survey voluntarily and electronically. Because the survey compares the current month against the previous three, however, it does not capture changes in credit accessibility over a longer period.
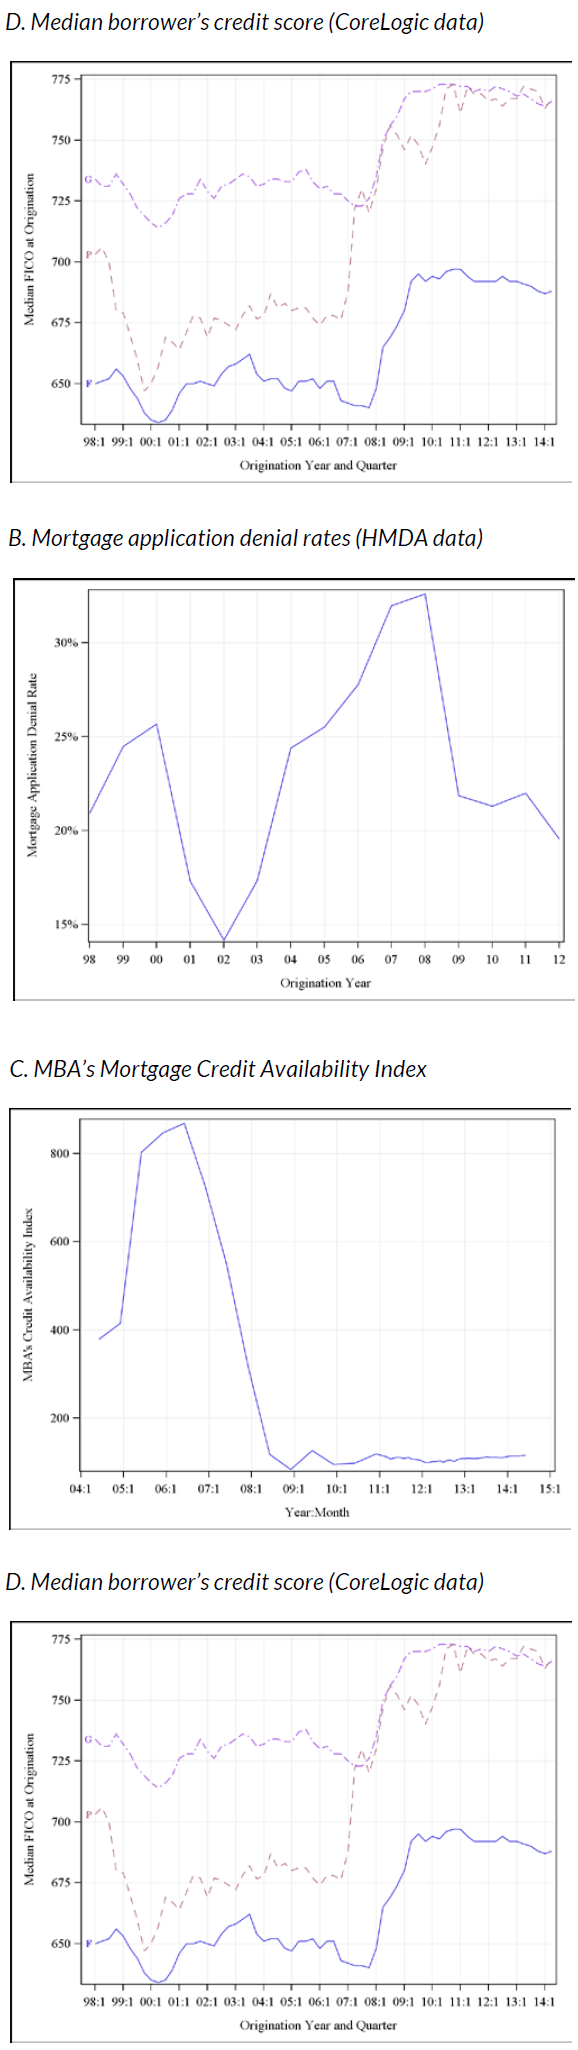
Figure 1A shows that in Q2 2007 the SLO indicated a net tightening of credit standards for prime mortgages of only 15 percent which climbed to 74 percent in Q3 2008 but it does not capture the loosening between 2003 and 2007. It also failed to recognize the popularity of risky products as a sign of loosening credit standards before the financial crisis and did not begin asking separately about changes in standards for prime, non-traditional, and subprime loans until Q2 2007, thus missing a critical change. The reliance on large commercial banks for reporting also excluded major players like Countrywide and Ameriquest.
Researchers use HMDA data to calculate denial rates as a measure of credit accessibility, usually as the number of applications denied divided by the total number of applications. This fails to take into account the applicants' credit profiles. An increase in applications by weaker-credit borrowers could increase the denial rate and indicate tighter credit access even when the actual credit environment has not changed. This accounts for the counterintuitive trend in figure 1.B: denial rates increase each year from 2002 through the boom, reaching a peak in 2007 and 2008, and fall again as the bottom falls out of the market in 2009.
Li and Goodman say that the MBA's MCAI which is relatively new, uses AllRegs to scan the credit guidelines for a large number of lenders, then aggregates the results into a single number. The resulting trend between 2004 and the present, shown in figure 1C is quite reasonable they say, but the index lacks transparency. "Though we know, for example, that this index takes many factors into account (such as loan purpose, amortization type, and property type) we have no way to know how numbers are assigned to these factors or to assess the formula that converts these many factors into a single index number."
The fourth measure of credit accessibility is the credit characteristics of loans made to the median borrower. This does reflect the amount of risk the market is willing and expected to take at a given time, for example the big jump in credit scores after the financial crisis. But the measure, in the authors' eyes, has two weaknesses. First, a credit score alone is insufficient as a measure of credit availability (disregarding as it does LTV, DTI, and other metrics) and the results using this measure are counterintuitive. They show a slight increase in median FICO scores for the private-label and bank portfolio channel between 2000 and 2006, indicating declining credit accessibility over a period widely perceived as driven by increasing accessibility. Similar to what was noted about the HMDA data, this was driven less by the amount of credit in the market than by the kinds of people applying for loans and the kinds of loans they were seeking.
Li and Goodman say that conceptually the market increases credit availability by taking more default risk so an alternative to the four existing measures is to look at the amount of default risk the market takes on at a given time. This gives a single comprehensive snapshot of the market that takes into account both accessibility and risk. Second, this measure more directly tracks market reality; a lower value indicates the market is taking less risk and making credit less accessible; a high value indicates the reverse.
To determine the default risk of a newly originated home purchase loan, operationally the HCAI probes an enormous database of historic loans to find a set that most closely matches the borrower characteristics and loan risk of the loan of interest. It then searches for and uses two historic default rates to determine the likely default risk of a newly originated loan:
- Normal-year default rate: The actual default rate (90+ days) of historic loans with similar characteristics originated in a year followed by normal economic conditions (2001 and 2002.
- Stressed-year default rate: The actual default rate of historic loans with similar characteristics originated in years followed immediately by economic stress (loans originated in 2005 and 2006).
It weights these two default rates according to the likelihood of normal or stressed scenario, assigning a 90 percent chance for a normal economic environment and a 10 percent chance for a stressed economic environment. The resulting number is the expected default risk the market takes in making this new loan or group of loans. This identifies with specificity the likelihood that a specific loan or group of loans will default and how much that default risk is due to the loan type vs. the borrower.
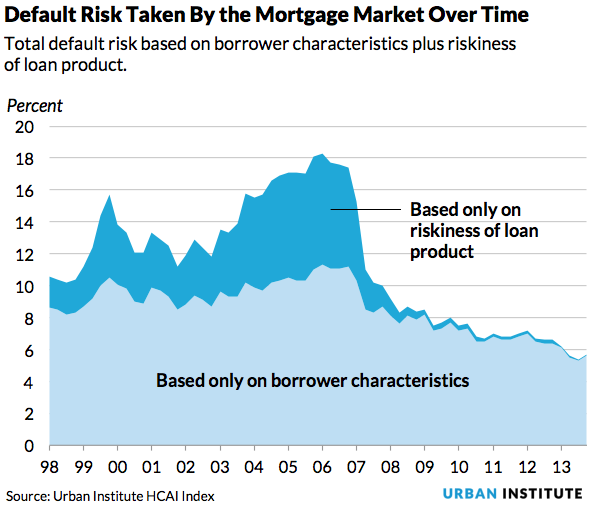
The authors say this figure shows "one of the most startling insights revealed by the HCAI: Product risk, not borrower risk, fueled the housing bubble." The mortgage default risk the market was willing to take peaked significantly from 2005-2008 and that in the bubble years, the market took almost twice the product risk it took in the pre-bubble years, while borrower risk held steady.
The HCAI also reveals that post-crisis, the mortgage market almost ceased to provide loans with risky terms and significantly curtailed its willingness to accept any borrower risk, dipping well below the level held nearly steady from 1998 to 2007. More recently, lenders have been taking only two-thirds of the borrower risk they consistently maintained in the pre-bubble and bubble years, which they call a tremendous over-correction.
Goodman and Li say that their measure will allow more accurate answers to such questions as:
- What segments of the mortgage market are serving borrowers with less than pristine credit today and how well are they serving these borrowers?
- What percent of the FHA-guaranteed loans made last year (or at any point in time) will default?
- How much will defaults rise if we loosen current GSE-lending standards?
- How tight are credit standards today?


