
Standard and Poor's has released the September S&P/Case-Shiller Home Price Index.
The S&P/Case-Shiller Home Price Indices are constructed to accurately track the price path of typical single-family homes located in each metropolitan area provided. Each index combines matched price pairs for thousands of individual houses from the available universe of arms-length sales data. The indices have a base value of 100 in January 2000; thus, for example, a current index value of 150 translates to a 50% appreciation rate since January 2000 for a typical home located within the subject market. This report is two months backward looking.
Reuters Quick Recap...
- RTRS-US SEPT HOME PRICES IN 20 METRO AREAS -0.8 PCT SEASONALLY ADJ (CONSENSUS -0.3) VS AUG'S REVISED -0.5 PCT-S&P/CASE-SHILLER
- RTRS-US SEPT 20-METRO AREA HOME PRICES -0.7 PCT (CONSENSUS -0.2) VS REVISED -0.2 PCT IN AUG - S&P/CASE-SHILLER
- RTRS-US SEPT 20-METRO AREA HOME PRICES +0.6 PCT (CONSENSUS +1.1 PCT) FROM YEAR AGO -- CASE-SHILLER
- RTRS-US SEPT HOME PRICES IN 10 METRO AREAS -0.7 PCT SEASONALLY ADJUSTED VS REVISED -0.3 PCT IN AUG - CASE-SHILLER
- RTRS-US HOME PRICES IN 10 METRO AREAS -0.5 PCT IN SEPT VS -0.1 PCT IN AUG - S&P/CASE-SHILLER
- RTRS-US SEPT HOME PRICES IN 10 METROPOLITAN AREAS +1.6 PCT FROM YEAR AGO - S&P/CASE-SHILLER
- RTRS-US HOME PRICES IN Q3 2010 -2.0 PCT FROM Q2 2010 - S&P/CASE-SHILLER NATIONAL INDEX
- RTRS-US HOME PRICES IN Q3 2010 -1.5 PCT FROM Q3 2009 - S&P/CASE-SHILLER NATIONAL INDEX
- RTRS-U.S. Sept home prices fall faster than expected
WASHINGTON, Nov 30 (Reuters) - Prices of single-family homes in September fell more than twice as fast as expected from the prior month, while prices compared to a year earlier rose more slowly than forecast, according a widely watched index of U.S. home prices released on Tuesday.
The Standard & Poor's/Case-Shiller composite index of 20 metropolitan areas declined 0.8 percent in September from August on a seasonally adjusted basis. Economists polled by Reuters had expected a decline of 0.3 percent.
S&P, which publishes the indexes, also said home prices in the 20 cities index rose 0.6 percent from September 2009, slower than the 1.1 percent expected.
(Reporting by Corbett B. Daly; Editing by Chizu Nomiyama)
Excerpts from the Release....
New York, November 30, 2010 – Data through September 2010, released today by Standard & Poor’s for its S&P/Case-Shiller Home Price Indices, the leading measure of U.S. home prices, show that the U.S. National Home Price Index declined 2.0% in the third quarter of 2010, after having risen 4.7% in the second quarter. Nationally, home prices are 1.5% below their year-earlier levels. In September, 18 of the 20 MSAs covered by S&P/Case-Shiller Home Price Indices and both monthly composites were down; and only the two composites and five MSAs showed year-over-year gains. While housing prices are still above their spring 2009 lows, the end of the tax incentives and still active foreclosures appear to be weighing down the market.
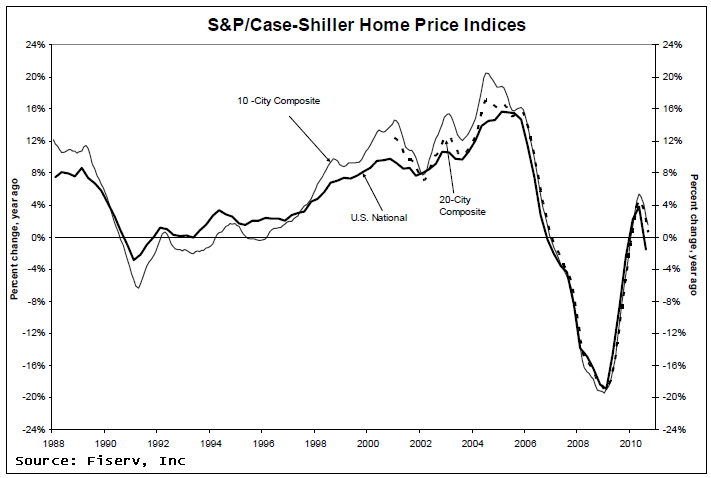
The chart above depicts the annual returns of the U.S. National, the 10-City Composite and the 20-City Composite Home Price Indices. The S&P/Case-Shiller U.S. National Home Price Index, which covers all nine U.S. census divisions, recorded a 1.5% decline in the third quarter of 2010 over the third quarter of 2009. In September, the 10-City and 20-City Composites recorded annual returns of +1.6% and +0.6%, respectively. These two indices are reported at a monthly frequency and September was the fourth consecutive month where the annual growth rates moderated from their prior month’s pace, confirming a clear deceleration in home price returns. The 10-City Composite posted a +1.6% annual growth rate in September, versus the +5.4% reported four months prior in May, and the 20-City Composite was up 0.6%, versus its +4.6% May print.
“Another weak report; weaker than last month. The national index is down 1.5% from the third quarter of last year and 15 of 20 cities are down over the last 12 months. Other than Tampa, FL, there are no new lows this month but many analysts will argue that a double dip will be confirmed before Spring. While some of the bad numbers may reflect the end of the government’s tax incentive for first time homebuyers, there are other problems weighing on the housing market.” says David M. Blitzer, Chairman of the Index Committee at Standard & Poor's. “The national economy is certainly the number one issue for housing. Additionally, there is a large supply of houses on the market and further, hidden, supply due to delinquent mortgages, pending foreclosures or vacant homes. New construction is running at less than half the pace needed to meet normal demand, so a sustained recovery could be a ways off.”
“Looking deeper into the data, in the monthly indices, 18 MSAs and both Composites were down in September over August. This is worse than August when 15 were down month-to-month. The only two which weren’t down in September were Las Vegas, which managed to stay a touch above the low set in July, and Washington DC. Overall, there are few, if any, good numbers in this month’s data.”


