
While it is only incremental, home price increases appear to have stopped decelerating and are again creeping slowly upward. Both the S&P CoreLogic Case-Shiller Indices and the Federal Housing Finance Agency's (FHFA's) Housing Price Index (HPI) for September posted small annual gains when compared to their previous month's numbers.
S&P National Index which covers all nine U.S. census divisions, rose 3.2 percent year-over-year in September compared to a 3.1 percent annual gain the prior month. The month's change from August was 0.1 percent before seasonal adjustment and 0.4 percent afterward.
The 10-City Composite's annual increase came in at 1.5 percent, identical to the average change in August, but the 20-City Composite was up 2.1 percent compared to 2.0 percent in the previous month. The 10-City Composite reflected no changes from September on a non-seasonally adjusted basis while the 20-City Composite rose 0.1 percent. After seasonal adjustment, the composites were up 0.2 percent and 0.4 percent respectively. Twelve of the 20 cities reported increases before seasonal adjustment while 17 were higher afterward.
The Sun Belt again controlled the leaderboard in terms of price gains. Phoenix led the way with a 6.0 percent annual increase, followed by Charlotte at 4.6 percent and Tampa up 4.5 percent. Ten of the 20 cities reported greater price increases in the year ending September 2019 versus the year ending August 2019.
"September's report for the U.S. housing market is reassuring," says Craig J. Lazzara, Managing Director and Global Head of Index Investment Strategy at S&P Dow Jones Indices. "The national composite index rose 3.2 percent relative to year-ago levels, with smaller increases in our 10- and 20-city composites. Of the 20 cities in the composite, only one (San Francisco) saw a year-over-year price decline in September. "After a long period of decelerating price increases, it's notable that in September both the national and 20-city composite indices rose at a higher rate than in August, while the 10-city index's September rise matched its August performance. It is, of course, too soon to say whether this month marks an end to the deceleration or is merely a pause in the longer-term trend.
"At a regional level, Phoenix retains the top spot for the fourth consecutive month with September's 6.0 percent year-over-year gain. The Southeast region was also strong, as Charlotte, Tampa, and Atlanta all rose at greater than a 4.0 percent clip."
The national index is now just shy of 15 percent higher than its pre-recession peak in July 2006 and has risen 58.4 percent from its 2012 trough. The 10-City Composite is 2.0 percent above its prior peak and the 20-City has gained 5.7 percent.
The S&P CoreLogic Case-Shiller Home Price Indices are constructed to accurately track the price path of typical single-family home pairs for thousands of individual houses from the available universe of arms-length sales data. The National U.S. Home Price Index tracks the value of single-family housing within the United States. The indices have a base value of 100 in January 2000; thus, for example, a current index value of 150 translates to a 50 percent appreciation rate since January 2000 for a typical home located within the subject market.
As of September 2019, the National Index was at 212.20 up from 212.06 in August. The 10- and 20-City Composites had readings of 230.89 and 218.27 respectively, compared to 230.83 and 218.14 the prior month. Los Angeles has the highest index at 287.36 and Cleveland the lowest at 128.43.
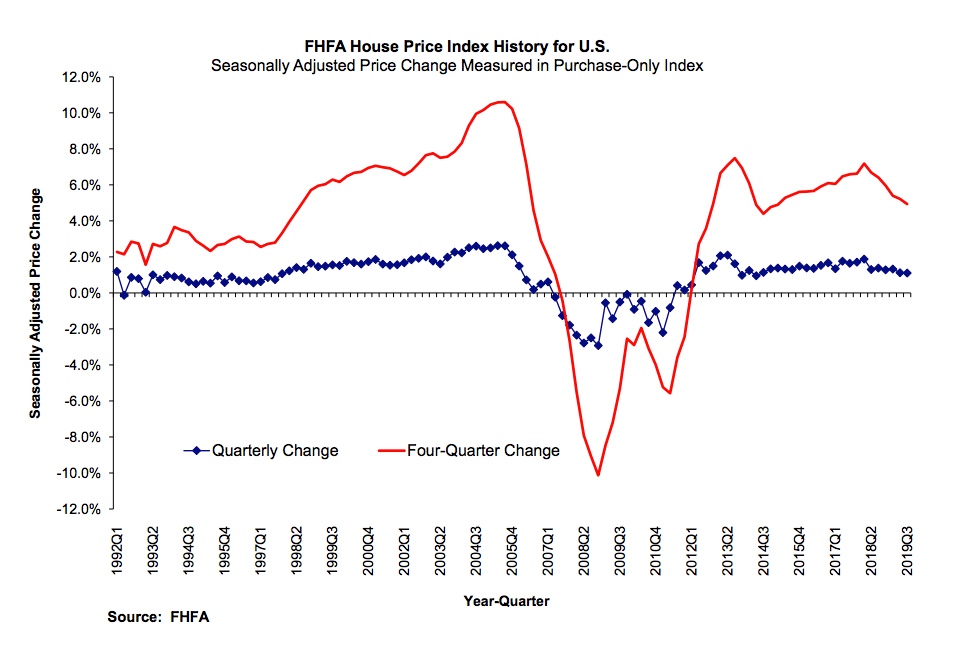
The FHFA index had not posted the degree of deceleration that other price indices had over the previous year until August. The rate of increase slowed appreciable then, from an annual gain of 5.0 percent in July to 4.6 percent while the monthly change, 0.2 percent, was half that of the prior month. Both numbers reversed course in September, rising again with an annual gain of 4.9 percent while the seasonally adjusted monthly increase was 0.6 percent. The gain in the third quarter was 1.1 percent.
"House prices have risen every quarter for the last eight years," said Dr. William Doerner, FHFA Supervisory Economist. "Relative to a year ago, market indices are still trending upward for the nation as a whole as well as in every census division, state, and the top 100 metro areas. Price gains, though, are continuing to slow their upward pace in a few cities with large housing markets."
Prices were up in all 50 states and the District of Columbia on a year-over-year basis. The highest gains were in Idaho at 11.6 percent, Maine and Arizona, each at 7.9 percent, Utah and Indiana at 7.8 and 7.4 percent respectively. The smallest gains were in Illinois, Connecticut, Maryland, and South Dakota, all with annual increases of 2.7 percent or less.
Of the nine census divisions, the Mountain division experienced the strongest four-quarter appreciation, 6.9 percent, with a 1.8 percent increase in the third quarter of 2019. Annual house price appreciation was weakest in the Middle Atlantic division, where prices rose by 4.0 percent between the third quarters of 2018 and 2019.
The FHFA HPI is based on the purchase price of homes financed through loans acquired by Fannie Mae or Freddie Mac.


