The Census Bureau and the Department of Housing and Urban Development today released New Home Sales survey data for October 2009.
The survey is primarily based on a sample of houses selected from building permits. Since a “sale” is defined as a deposit taken or sales agreement signed, this can occur prior to a permit being issued. Changes in sales price data reflect changes in the distribution of houses by region, size, etc., as well as changes in the prices of houses with identical characteristics. It takes four months to establish a trend of new home purchases
Last month, single family new home sales fell for the first time since March, snapping a five month trend of increasing sales. The pace of new homes sales was 402,000 sales per year, well below economist's expectations for a pace of 440,000 annual new home sales. This was a 3.6% decline from August new home sales. New home supply was unchanged at 7.5 months. The median home sale price was 204,800...9.1% lower from September 2008.
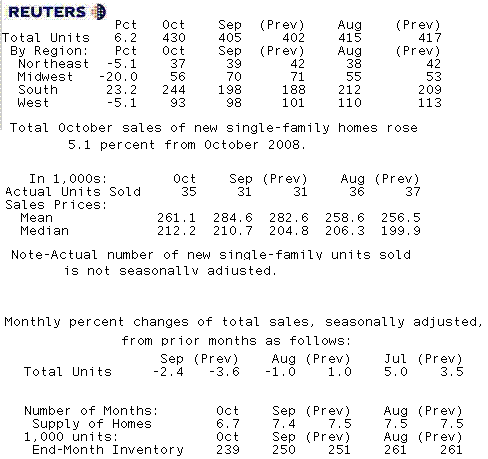
In today's release, which reported on October survey data, sales of new single family houses rose 6.2% to a rate of 430,000 annual transactions, much better than the market's expectation for 410,000 annual sales and 25,000 units higher than the revised higher 405,000 pace reported in September.
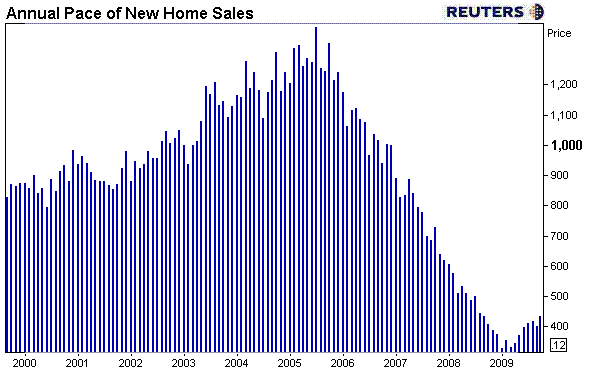
Below is a chart of the month over month change in the pace of annual new home sales. Notice the current rate is well below normal...
The estimate of new houses for sale at the end of October was 239,000. At the current annual pace of sales, new home supply will last for 6.7 months....the lowest amount of supply since December 2006. The median sales price of new houses sold in October 2009 was $212,200; the average sales price was $261,100.
Here is a table recapping the data...