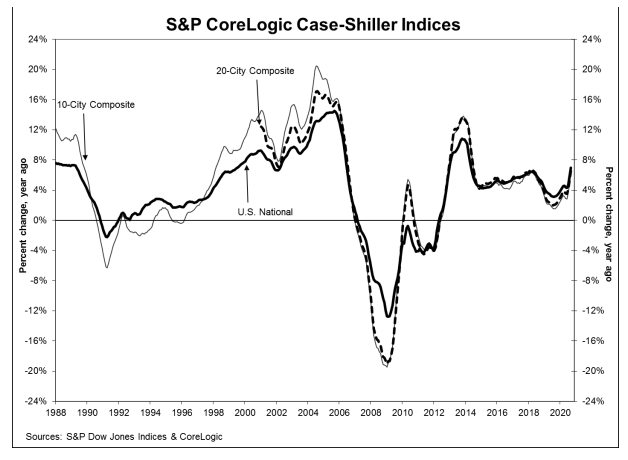
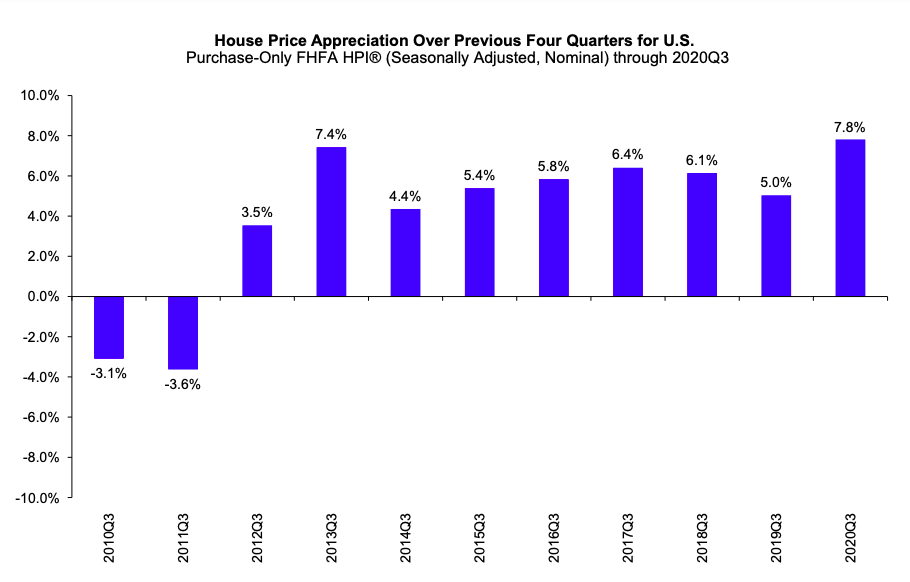
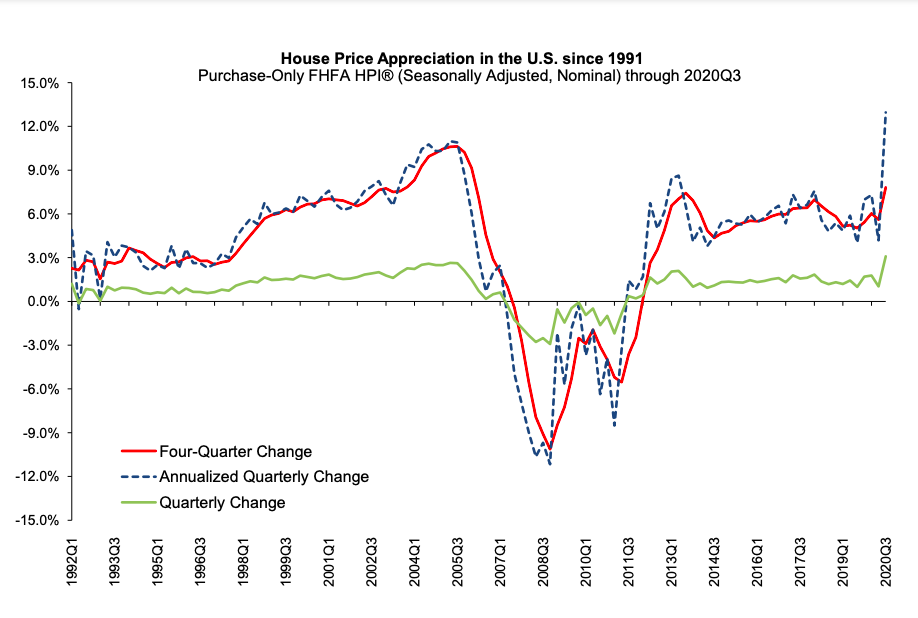
Annual price increases in September were quite literally off the charts. Both the S&P CoreLogic Case-Shiller National Index and the Housing Market Index from the Federal Housing Finance Agency (FHFA) recorded annual appreciation of at least 7 percent.
The Case-Shiller National Index, which covers all nine U.S. census divisions, reported a 7.0 percent annual gain in September, up from the August increase of 5.8 percent. The National Index posted 1.2 percent month-over-month growth before seasonal adjustment and 1.4 percent afterward.
As has been the case since the beginning of the pandemic, housing data from Wayne County, Michigan where Detroit is located has been insufficient to include the city in the indices. The 10-City Composite annual increase came in at 6.2 percent and the 20 City at 6.6 percent. The two composites had appreciated in August by 4.9 percent and 5.3 percent, respectively. On a monthly basis the 10-City increased 1.3 percent before adjustment and 1.2 percent afterward, while the 20 City's gains were the reverse, rising 1.2 percent before adjustment and 1.3 percent afterward. In September, all 19 cities (excluding Detroit) reported increases before and after seasonal adjustment.
The 20-City Composite is the Case-Shiller Component about which analysts usually offer a forecast. They badly undershot the mark for September. Analysts polled by Econoday were expecting an annual increase of 5.4 percent, Trading Economics predicted a 5.1 percent gain.

Phoenix, Seattle, and San Diego continued to report the highest year-over-year gains among the 19 cities. Phoenix led with an 11.4 percent year-over-year price increase, followed by Seattle, up 10.1 percent increase and San Diego at 9.5 percent. All 19 cities reported higher price increases in the year ending September 2020 versus the year ending August 2020.
"Housing prices were notably - I am tempted to say 'very' - strong in September," says Craig J.
Lazzara, Managing Director and Global Head of Index Investment Strategy at S&P Dow Jones Indices.
"The National Composite Index gained 7.0 percent relative to its level a year ago, well ahead of August's 5.8 percent increase. The 10- and 20-City Composites (up 6.2 percent and 6.6 percent, respectively) also rose at an accelerating pace in September. The strength of the housing market was consistent nationally - all 19 cities for which we have September data rose, and all 19 gained more in the 12 months ended in September than they had done in the 12 months ended in August.
"A trend of accelerating increases in the National Composite Index began in August 2019 but was interrupted in May and June, as COVID-related restrictions produced modestly-decelerating price gains. Our three monthly readings since June of this year have all shown accelerating growth in home prices, and September's results are quite strong. The last time that the National Composite matched September's 7.0 percent growth rate was more than six years ago, in May 2014. This month's increase may reflect a catch-up of COVID-depressed demand from earlier this year; it might also presage future strength, as COVID encourages potential buyers to move from urban apartments to suburban homes. The next several months' reports should help to shed light on this question.
"Phoenix's 11.4 percent increase topped the league table for September; this is the 16th consecutive month in which Phoenix home prices rose more than those of any other city. Seattle (10.1 percent) and San Diego (9.5 percent) repeated in second and third place. Even the worst-performing cities, New York (4.3 percent) and Chicago (4.7 percent), did better in September than in August. Prices were strongest in the West and Southwest regions, but even the comparatively weak Midwest scored 6.0 percent gains."
The S&P CoreLogic Case-Shiller Home Price Indices are constructed to accurately track the price path of typical single-family home pairs for thousands of individual houses from the available universe of arms-length sales data. The National U.S. Home Price Index tracks the value of single-family housing within the United States. The indices have a base value of 100 in January 2000; thus, for example, a current index value of 150 translates to a 50 percent appreciation rate since January 2000 for a typical home located within the subject market.
As of August 2020, the National Index was at 226.80 compared to 223.97 in August. The 10- and 20-City Composites had readings of 245.02 and 232.53 , up from 241.47 and 229.35. Los Angeles has the highest index reading at 309.33 and Cleveland (absent data on Detroit) the lowest at 138.24.
FHFA reported that its HPI was up 9.1 percent from the previous September compared to the 8.0 percent year-over-year gain reported for August. The index was up on a seasonally adjusted monthly basis by 1.7 percent. FHFA's report this month also includes data for the third quarter which showed house prices up 3.1 percent from the second quarter and 7.8 percent from the third quarter of 2019.
"House prices recorded their strongest quarterly gain in the history of the FHFA HPI purchase-only series in the third quarter of 2020," said Dr. Lynn Fisher, Deputy Director of the Division of Research and Statistics at FHFA. "Relative to a year ago, prices were up 7.8 percent during the quarter - the fastest year-over-year rate of appreciation since 2006. Monthly data indicate that prices continued to accelerate during the quarter, reaching 9.1 percent in September, as demand continues to outpace the supply of homes available for sale."
FHFA said that September marked the 37th consecutive quarter that home prices have risen. That string started in September 2011.

The third quarter saw prices rise in all 50 states and the District of Columbia compared to the same quarter in 2019. The largest increases were in Idaho 14.4 percent; Arizona 11.1 percent; Washington 10.8 percent; Utah 10.7 percent; and Tennessee 10.0 percent. Idaho has been the leading state for the last 8 quarters. Gains were also seen in all the 100 largest metro areas with the largest in Boise at 16.4 percent.

The greatest increase among the nine census divisions, was in the Mountain division, up 9.6 percent. That division has led the nation for the last 12 quarters.
The FHFA HPI is based on the purchase price of homes financed through loans purchased or acquired by the GSEs Fannie Mae and Freddie Mac. The index was benchmarked to 100 in January 1991. The September reading was 302.60.


