
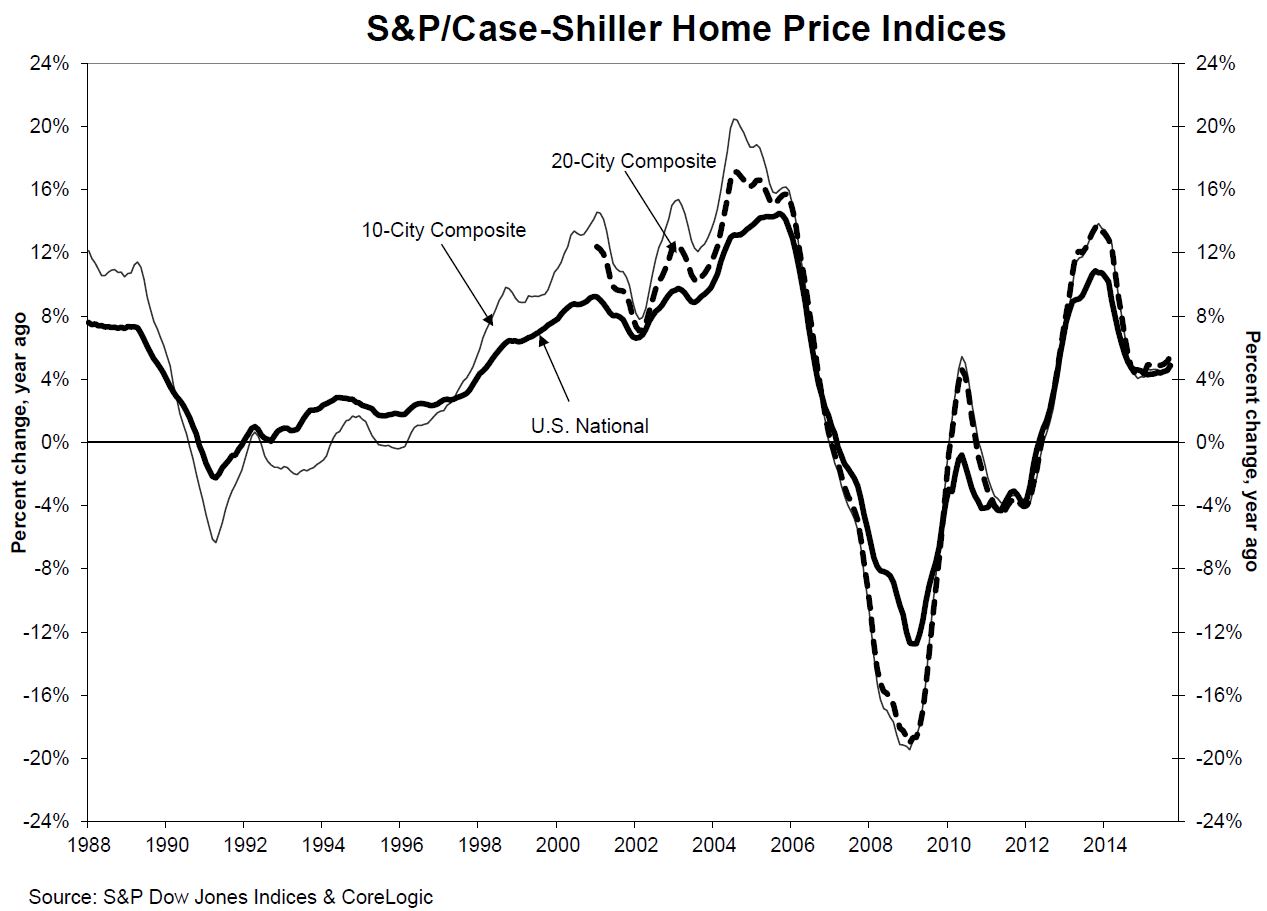
Home prices continue to rise faster than the rate of inflation and the increase speeded up again in September. The S&P/Case-Shiller U.S. National Home Price Index (HPI), recorded a slightly higher year-over-year gain in September, up 4.9 percent compared to the 4.6 percent annual increase posted across the nine U.S. census divisions in August.
The 10-City Composite increased 5.0 percent over the 12 previous months in September compared to 4.7 percent change in August while the 20-City Composite's year-over-year gain was 5.5 percent versus 5.1 percent. After adjusting for the Consumer Price Index (CPI) core rate of inflation, the National HPI rose 3 percent from September 2014 to September 2015.
On a month-over-month basis the National HPI gained 0.2 percent from August on a non-seasonally adjusted basis and 0.8 percent adjusted. The 10-City Composite and 20-City Composite indices both reported gains of 0.2 percent unadjusted for the month and 0.6 percent when seasonally adjusted.
The 20-City Composite beat analysts' consensus expectations for both the month and the year. Bloomberg reported an estimate of 0.3 percent on a seasonally adjusted basis month-over-month and 5.3 percent for the annual increase.
Fifteen of 20 cities tracked by Case-Shiller reported increases in September before seasonal adjustment. After seasonal adjustment, 19 increased for the month.
The highest annual gains were reported by San Francisco at 11.2 percent, Denver at 10.9 percent and Portland, Oregon at 10.1 percent. Price increases escalated on an annual basis compared to August in 17 of the Composite cities with Phoenix having the longest continuous streak of such gains, 10 months.
David M. Blitzer, Managing Director and Chairman of the Index Committee at S&P Dow Jones Indices said, "Home prices and housing continue to show strength with home prices rising at more than double the rate of inflation. The general economy appeared to slow slightly earlier in the fall, but is now showing renewed strength. With unemployment at 5 percent and hints of higher inflation in the CPI, most analysts expect the Federal Reserve to raise its Fed Funds target range to 25 to 50 basis points, the first increase since 2006. While this will make news, it is not likely to push mortgage rates far above the recent level of 4 percent on 30 year conventional loans. In the last year, mortgage rates have moved in a narrow range as home prices have risen; it will take much more from the Fed to slow home price gains.
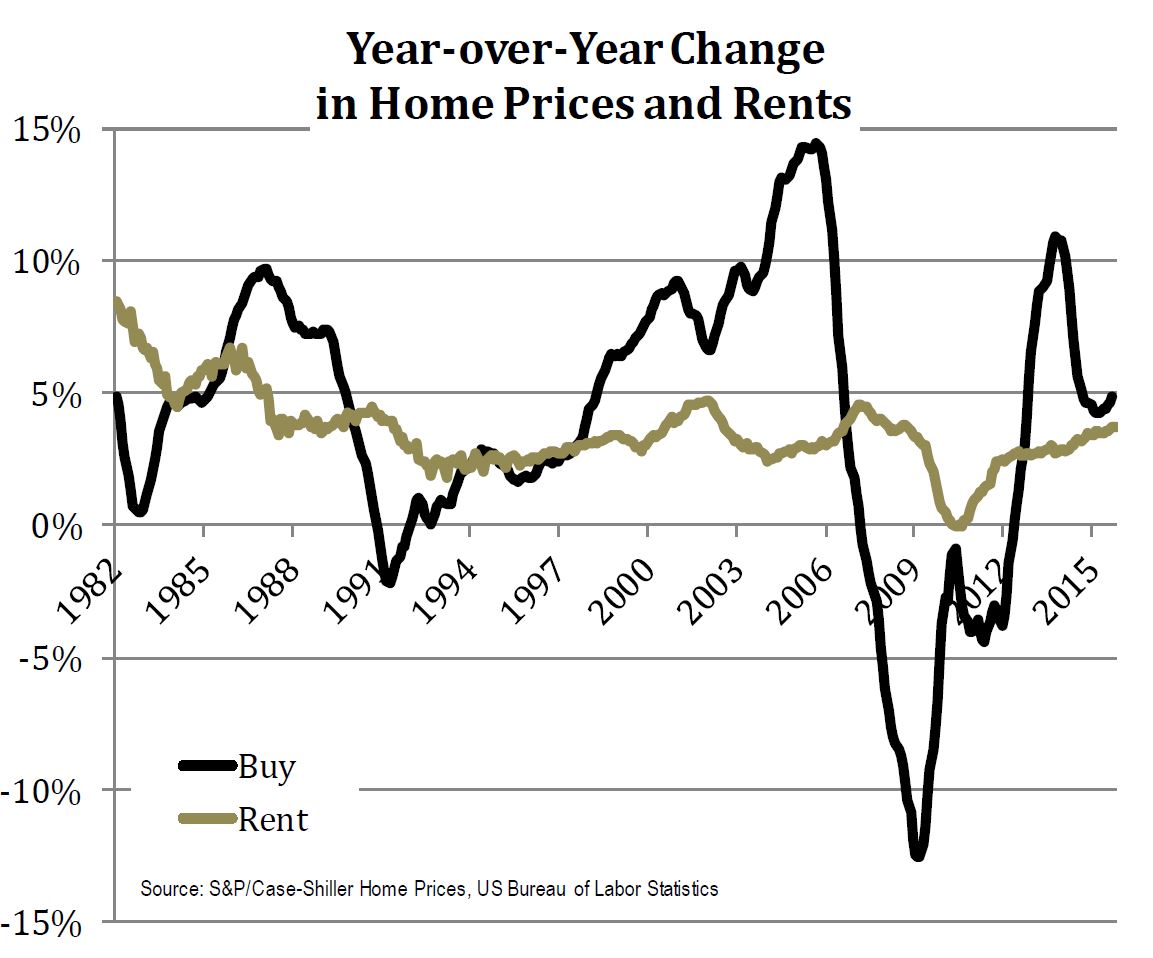
"The strength seen in home prices since the bottom in 2012 led some to wonder if we're entering a new bubble," Blitzer continued. "While bubbles can only be reliably identified in hindsight, one useful measure compares the increase in home prices to the change in rents. The first chart below shows the year-over-year change in the S&P/Case-Shiller National Home Price Index and the year-over- year change in the rent of primary residence series reported as part of the Consumer Price Index. Home prices are far more volatile. At the same time, the most recent data do not show a huge spread between the two series."
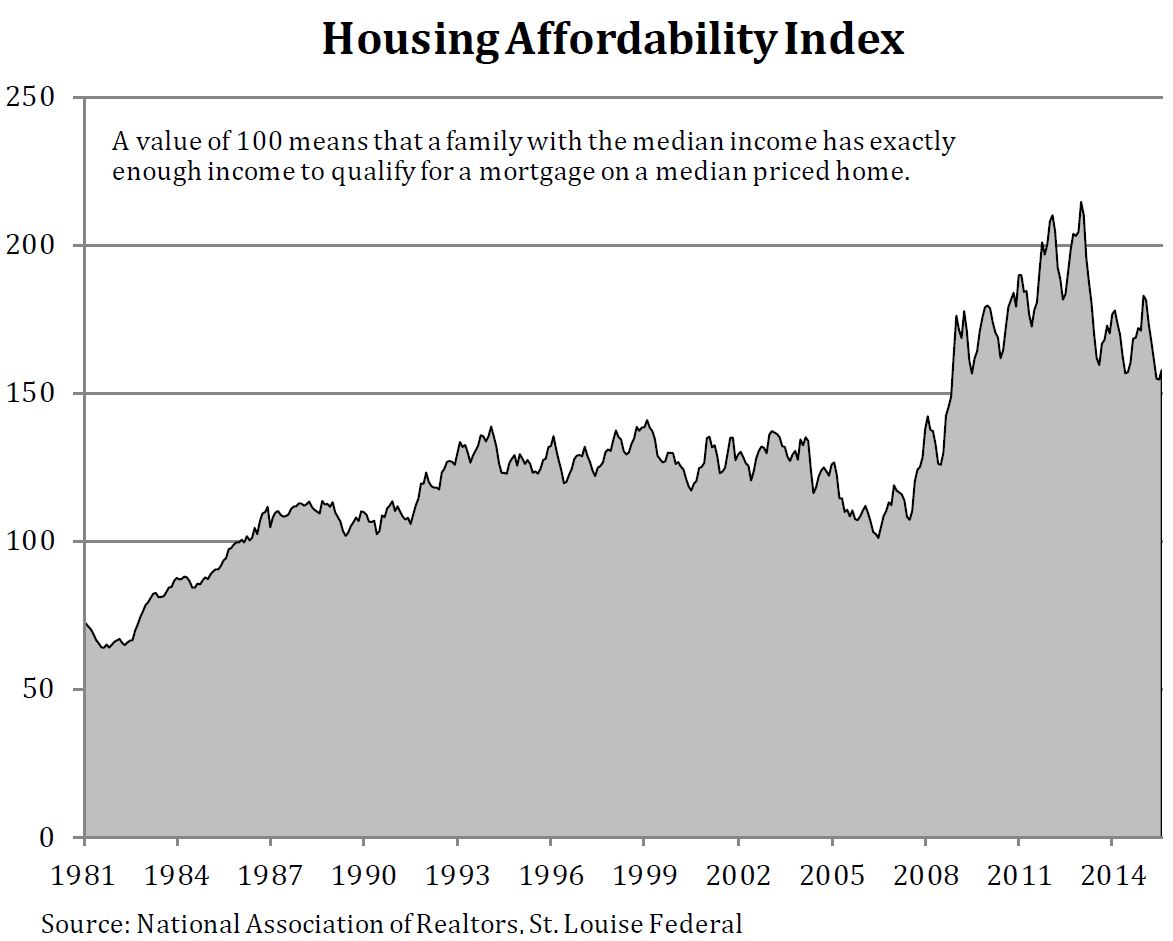
"Another question raised by consistent real (or inflation adjusted) home price increases is whether the prices are squeezing people out of the market," Blitzer said. "One measure of affordability is based on median income, median home price, and mortgage rate; a value of 100 on the chart below indicates a home buyer at the median income can afford the median price home. As shown on the chart, affordability is more than adequate for a median income buyer now but has slipped a bit recently."
As of September 2015, average home prices for the metro areas within the 10-City and 20-City Composites are back to their winter 2007 levels. Measured from their June/July 2006 peaks, the peak-to-current decline for both Composites is approximately 11-13 percent and they the 10-City has recovered by 35.1 percent since its March 2012 low and the 20-City by 36.4 percent.
The S&P/Case-Shiller Home Price Indices are constructed to accurately track the price path of typical single-family home pairs for thousands of individual houses from the available universe of arms-length sales data. The S&P/Case-Shiller National U.S. Home Price Index tracks the value of single-family housing within the United States. The indices have a base value of 100 in January 2000; thus, for example, a current index value of 150 translates to a 50% appreciation rate since January 2000 for a typical home located within the subject market.
The 10-City Composite currently has an index level of 197.84 and the 20-City a value of 182.91. The National Index is at 175.51. Detroit is the city with the lowest index at 103.81 and Los Angeles has the highest at 238.91.


