
Property taxes are collected by virtually all local governments; levied on land, commercial properties, and residential homes. Taxes are generally determined by a combination of the assessed value of the property, the share of that value subject to tax, the property tax rate and the tax base. These taxes are an important source of revenue at the local level although rates vary substantially across the nation but in most localities are around $1000 per homeowner and below 1 percent of house value.
Two associates of Brookings, the Urban Institute and the Urban-Brookings Tax Policy Center have done a comprehensive study of these taxes at the county level. The authors are Benjamin H. Harris, policy director of the Hamilton Project and a fellow in economic studies at Brookings and Brian David Moore, a research assistant at the Urban-Brookings Tax Policy Center.
For residential homeowners, the burden of the property tax makes up about one quarter of homeownership costs over the course of a median duration of ownership. States have enacted a wide variety of laws to limit this burden including restrictions on the formula for the rate and assessments and outright elimination of tax liability. Homestead exemptions lower property taxes for owner occupants, "circuit breakers" reduce tax levels of specific homeowners such the elderly, abatements limit taxes of designated land or classes of taxpayers such as veterans. Virtually all states limit the scope of property taxes in some ways but the nature and strength of the limitations vary widely.
The authors say that economists do not agree on how to treat property taxes theoretically with some viewing them as a benefit tax providing revenue for local amenities while others view them as a tax on capital, serving to depress returns to capital and distort investment decisions. Characteristics such as progressivity and efficiency depend on one's interpretation of the theoretical classification of the tax.
Property taxes make up 34.6 percent of total local revenues and 63.9 percent of local own-source revenue. They tend to be a stable revenue source as governments set a revenue target then vary the tax rate accordingly. Even in the aftermath of the Great Recession, in which property values in the United States underwent historic declines, property tax revenue fell less than house prices did.
Using data from the American Community Survey (ACS), the authors found that most homeowners self-reported their property tax burdens at between 0.5 percent and 1.0 percent of their homes value or $500 to $2,000. These self-reported burdens vary substantially by region, with especially high rates in the Northeast and parts of the Midwest. While property tax burdens vary substantially across counties-with 2011 property taxes as a share of home values ranging from 0.2 percent (Maui County, Hawaii) to 3.1 percent (Wayne County, New York) -most of the variation is due to variation across rather than within states, in part reflecting state laws and dependence on property taxes versus other state and local revenue sources.
That property taxes are a stable source of revenue is evidenced by figures gathered between 1981 and 2008. Aggregate property taxes remained between 24 and 27 percent of total revenues which includes intergovernmental transfers and between 37 and 41 percent of own-source revenues. Prior to 1981 the property tax represented a larger component of revenues but tax revolts in some states led to legislative changes to limit the taxes.

After 2008 the share of local revenues increased, largely because property taxes responded more slowly to the Great Recession than other sources of revenue. Changes in housing prices usually lag in their effect on assessed values and in 2009, two years after prices began to plummet, property taxes peaked. By Q1 2012 property tax revenues had fallen for six straight quarters. Other studies have found that the lag typically occurs over three years and even then declines in home values do not lead to proportional declines in revenues as governments may adjust tax rates in response to falling prices.
Revenues vary in their importance to local governments by region. In the Northeastern states at least 30 percent of local revenues is derived from property taxes while many west coast and southern states garner less than 20 percent of revenues this way. Taxes, on both a per capita and share of revenue basis, are highest in the Northeastern states and lowest in the South.
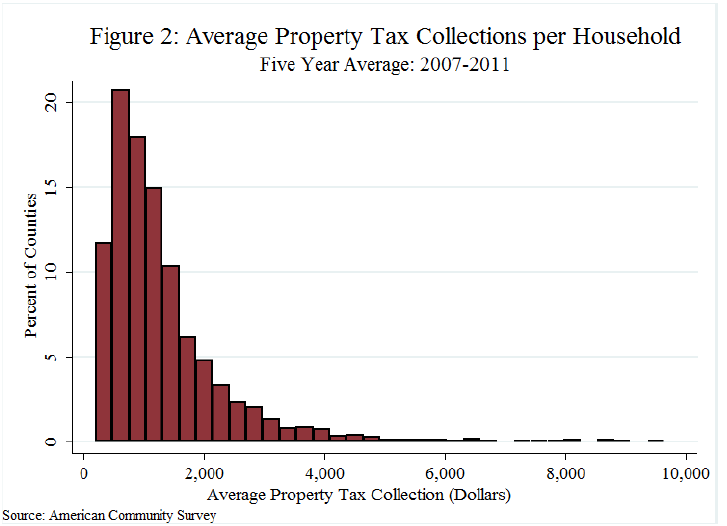
From ACS data the authors found that 60 percent of counties had an average tax burden between $500 and $1,500 per homeowner. Homeowners in about 13 percent of counties paid less on average and 27 percent paid more. Only 3 percent of counties have average bills exceeding $4,000 and only nine had bills over $8,000.
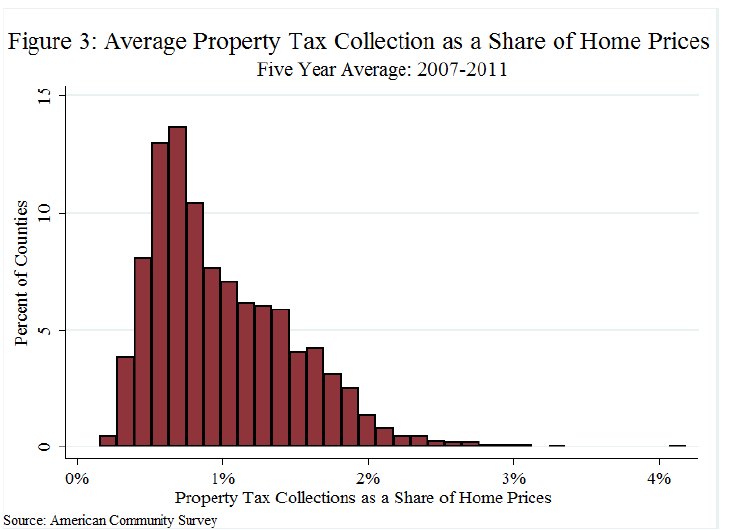
In the 2007-2011 period about 60 percent of counties had property tax bills of less than 1 percent of median home values. About 37 percent had bills between 1 and 2 percent of home values. Of the three percent of counties with property taxes of more than 2 percent of home value only five counties exceeded 3 percent.
At the state level most states fell between $1,000 and $3,000 in per-household property tax revenues but ten had averages in excess of $3,000 and eight, almost all in the south, averaged less than $1,000. As a share of housing values, residents in all but 14 states paid between 0.5 percent and 1.5 percent in taxes. Residents in three states, Delaware, Hawaii, and Louisiana, paid 0.5 percent or less, while residents in 11 states, Connecticut, Illinois, Michigan, Nebraska, New Hampshire, New Jersey, New York, North Dakota, Texas, Vermont, and Wisconsin, paid more than 1.5 percent.
The authors found that almost all variation in property taxes burdens in counties resulted from across- rather than within-state variation; that is almost exclusively as a result of differences in state rather than county-level tax regimes, differences in tax rates or housing prices. However, some states do exhibit more variation than others, some in terms of absolute dollars (Illinois, New Jersey, Virginia) and some as a share of house prices (Pennsylvania, Michigan, and Texas) or both (New York.)
Measured in dollars, the tax burden is highest in counties in California, Illinois, and the Northeast where the mean property tax burden typically amounts to $3000 or more. This is in part a reflection of high property values rather than a variation in tax rates. For example, the mean housing value for the ten states with the lowest absolute property tax burden is $127,341, compared with an average house value of $356,085 in the ten states with the highest absolute tax burden. Households in the Mountain West and Southeast regions tend to have lower burdens regardless of metric.
The counties with the highest property taxes paid per homeowner are those surrounding New York City. Westchester, Nassau, and Bergen counties had the three highest average tax burdens, all in excess of $8,500; this in part reflects higher house prices and higher reliance on property taxes to provide state and local services. The counties with the highest property tax burdens tend to be in New York and New Jersey, with all but three of the top 25 counties being from these two states. Conversely, 24 counties had average property taxes below $250; almost all of these counties were located in Alabama or Louisiana.
The authors conclude that property taxes will continue to serve as a critical revenue source for local governments in the foreseeable future. But the property tax is not just relevant as a stream of revenue. As it is often tied to education spending, it has important consequences for school financing and the health of public education. And, as a tax on owner-occupied housing, the property tax affects the cost of residential investment, the housing sector, and the personal finances of homeowners.


