Home prices continued to slide in August, dropping another 0.9 percent according to the Lender Processing Services (LPS) home price index (HPI). With the inclusion of the August data, home prices are now down 0.38 percent since August of 2010 and 4.0 percent from the beginning of this year.
The peak of the housing boom was reached in June 2006 when the U.S. housing inventory as measured by LPS stood at $10.6 trillion. Since that date, the HPI has declined 2.3 percent and the value of the inventory now stands at $7.65 trillion.
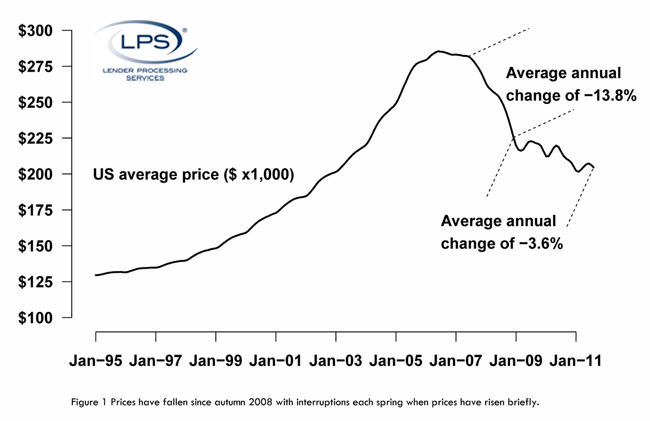
The most rapid period of home devaluation occurred between July 31, 2007 and December 2009 when princes fell from 282,000 to $226,000, an annual decline of 13.8 percent. Since that time the pace of decline has slowed, interspersed with brief seasonal periods of rising prices. The national average home price in 2010-2011 has lost another $20,000, an annual decline of 3.6 percent.
Price changes were largely consistent across the country during August, increasing in only five percent of ZIP codes tracked by LPS. Higher-priced homes had smaller declines: -0.72 percent for the top 20 percent of homes (prices above $321,000) compared to -1.0 percent for the bottom 20 percent (below $103,000).
Where prices declined in one MSA within any given state, they tended to decline in all of them. The average prices of all MSAs in a state declined together for 347 of the 404 MSAs covered by the LPS HPI.
Among the 26 largest MSAs, ten have seen declines. The largest losses have been in Atlanta (-10.5 percent) and Phoenix (-5.2 percent). The biggest increases were in Detroit (10.8 percent) and Pittsburgh (4.5 percent). Since last August only six of the largest MSA's have not declined. New York has been essentially stable for the last year while Detroit increased 5.3 percent in Detroit, Honolulu 3.3 percent, Miami 0.6 percent, and Pittsburgh 3.2 percent. Pittsburgh, in fact, has seen its prices actually rise since the peak in 2007, the only MSA where that has occurred.